Açıklama
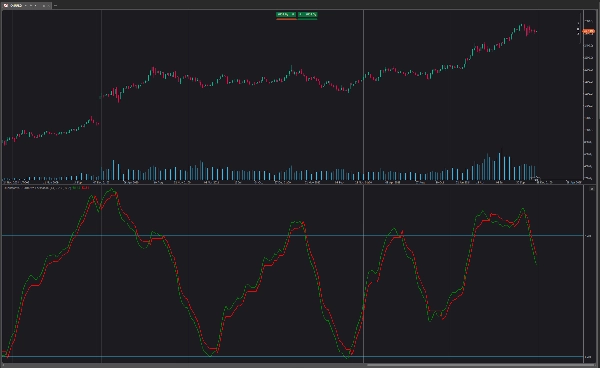
QQE (Nicel Nitel Tahmin) Ağırlıklı Osilatör, orijinal versiyonunu, trailing stop tarafından verilen göstergelere dayalı olarak RSI'yı ağırlıklandırarak geliştirir; bu da trailing stop ile bir kesişmenin gerçekleşmesi için daha fazla çaba gerektirir. QQE Ağırlıklı Osilatör, düzgünleştirilmiş bir RSI osilatörü ve bu aynı RSI'dan türetilen bir trailing stop'tan oluşur.
Osilatör, piyasanın aşırı alım/aşırı satımda olup olmadığını göstermek için ve RSI'nın öncü doğası sayesinde trend dönüşlerinin erken bir göstergesi olarak kullanılabilir.
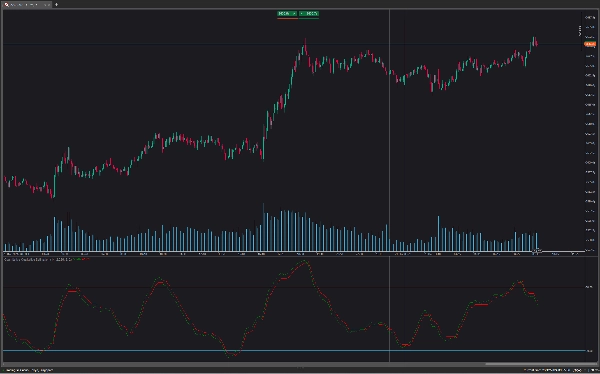
Daha yüksek Faktör değerleri daha uzun vadeli bir trailing stop döndürecektir.
Normal bir RSI gibi, uyumsuzluk bir dönüşün göstergesi olabilir.
Daha fazla ağırlıklandırma, trailing stop'un RSI'yı kesmesi için ne kadar "çaba" gerektiğini kontrol eder. Örneğin, yüksek ağırlıklar kullanıldığında, trailing stop'un üzerinde bir RSI'nın potansiyel bir kesişme için daha yüksek derecede negatif fiyat değişiklikleri gerektirecektir.
Bu, daha yüksek ağırlıkların daha döngüsel ve daha düzgün sonuçlar vermesine neden olabilir.
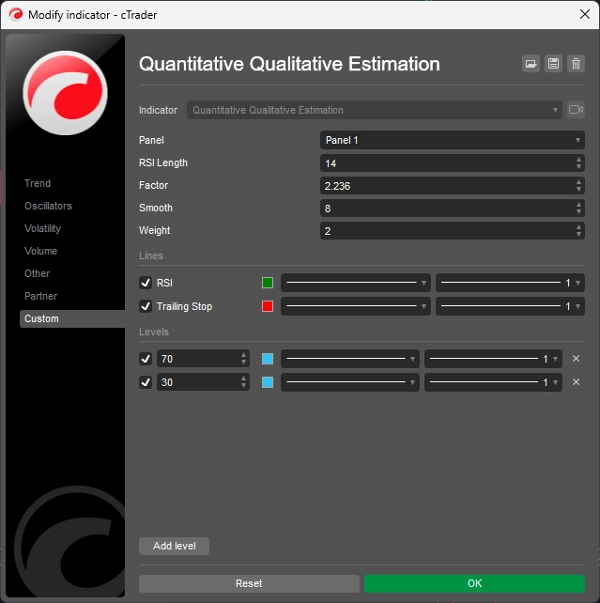
Ayarlar nasıl değiştirilir:
- Uzunluk: RSI osilatörünün uzunluğu.
- Faktör: Trailing stop hesaplamasında kullanılan çarpan faktörü.
- Düzgünleştirme: RSI osilatörünün düzgünlük derecesi.
- Ağırlık: RSI hesaplamasında kullanılan ağırlık derecesi.
Özet
Müşteri değerlendirmeleri
5 | 100 % | |
4 | 0 % | |
3 | 0 % | |
2 | 0 % | |
1 | 0 % |