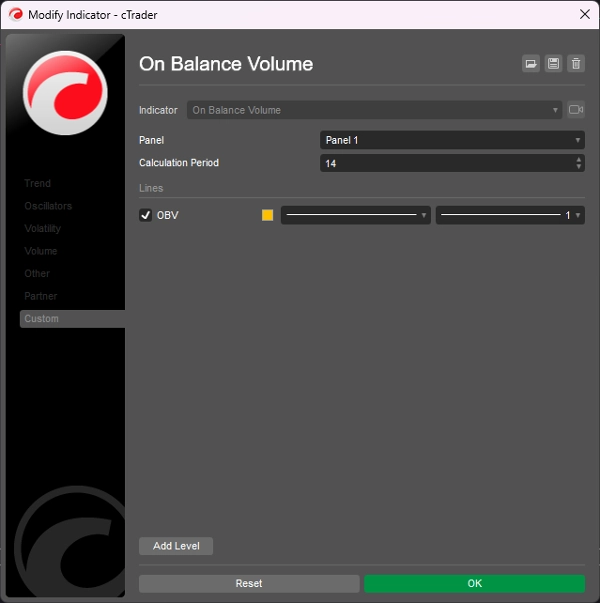
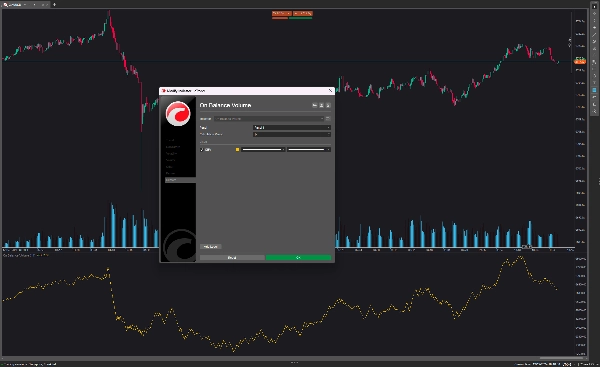
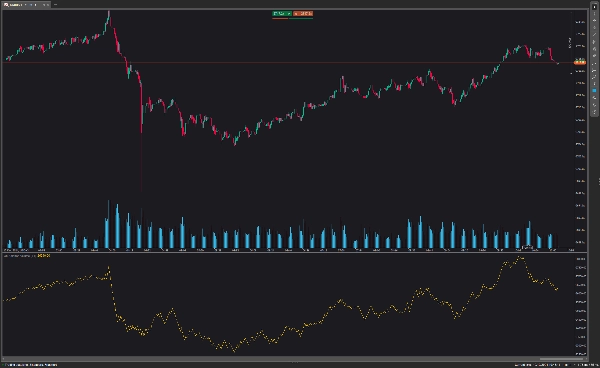
โบรกเกอร์และ Props
สำหรับธุรกิจ
00
Days
:
00
Hours
:
00
Minutes
:
00
Seconds
On Balance Volume
5.0
03/09/2025
182
Desktop
ตั้งแต่ 03/10/2024
การขาย
1
ติดตั้งฟรี
5918
"On Balance Volume" ภาพที่อัปโหลด"On Balance Volume" ภาพที่อัปโหลด"On Balance Volume" ภาพที่อัปโหลด

On Balance Volume (OBV) measures buying and selling pressure as a cumulative indicator that adds volume on up days and subtracts volume on down days.

The On Balance Volume is displayed at the bottom of the chart. The OBV line goes up when today's closing price grows and goes down when yesterday's closing price is higher than the current one.

The OBV indicator generally identifies a breakout before the price line does and helps in establishing a clear upward trend. If you want to trade with this strategy, you open a forex position at the breakout price level and place a stop loss above the recent high swing

5.0
รีวิว: 1
5
100 %
4
0 %
3
0 %
2
0 %
1
0 %
รีวิวจากลูกค้า
August 18, 2025
Pros: A lightweight cumulative volume indicator that confirms price moves and detects divergences. Excellent for analyzing trend strength and sentiment. Cons: No alerts, tooltips, or template features. Signals may lag in volatile or manipulated markets.
เพิ่มเติมจากผู้เขียนคนนี้
เรตติ้งสูง
ฟรี
PMAX
It's a combination of two trailing stop loss and the other one is well-known ATR-based SuperTrend.
cBot
Grid
RSI
XAUUSD
+18
Investion X V1.9 - Intelligent Filter-Based Trading System
Trading system combining martingale strategy with multi-layered technical analysis and comprehensive protection features
StochasticRSI
Stochastic RSI (StochRSI) is a technical indicator used to measure the strength and weakness of the RSI.
เรตติ้งสูง
ฟรี
Machine Learning Momentum Index
The Machine Learning Momentum Index (MLMI) represents the next step in oscillator trading.
Laguerre RSI
Laguerre RSI is based on John EHLERS' Laguerre Filter to avoid the noise of RSI.
KDJ
The KDJ oscillator display consists of 3 lines (K, D and J - hence the name of the display) and 2 levels.
Quantitative Qualitative Estimation
The QQE (Quantitative Qualitative Estimation) Weighted Oscillator improves its original version by weighting the RSI.
Darvas Box
The Darvas Box involves identifying "boxes" or trading ranges where a stock's price consolidates before breaking out.
Ichimoku Cloud Indicator
The Ichimoku Cloud is a comprehensive technical analysis system developed by Japanese journalist Goichi Hosoda
Chaikin Money Flow
Chaikin money flow's primary purpose is to distinguish between periods of accumulation and distribution of a security.
cBot
Grid
Martingale
Investion Basic
This is a basic martingale bot without an indicator. For long and short trading options at the same bot.
นอกจากนี้คุณยังอาจชอบ
FAIR VALUE GAP INDICATOR
Pinpoint FVGs, track fills and see mitigation stats — trade imbalances with clarity and confidence.
Time To Break Even Indicator v2
Time To Break Even Indicator. This indicator helps you time your trade's entry.
อินดิเคเตอร์
Indices
Breakout
Supertrend
[CB] Pivot Points Pro
You can use the cTrader Pivot Points Pro indicator to find a good pullback entry in a trend
TrendMaster Pro MultiMA
Connects each moving average value from candle to candle, forming a fan-like structure of trendlines.
CandleColourFlow_Limited_EURUSD
CandleColourFlow – smart color-coded trend indicator.
VMM PositionPivotPro
Professional position management! Calculate real-time pivots, monitor P&L & costs, and strengthen your strategy.
อินดิเคเตอร์
Indices
Stocks
Commodities
+2
SymbolTFOverlay
The SymbolTFOverlay display the current symbol and timeframe as a semi-transparent text overlay on the chart.
Supply Demand V1-Premium
Auto-detect supply & demand zones, remove broken levels, and trade smarter with real-time alerts. Precision made simple.
FVG
The Indicator is a powerful tool for price-action traders seeking to identify and exploit short-term imbalances.
PinBarCandlestickPattern
PinBarCandlestickPattern Indicator
Candles Volume Delta
CANDLES VOLUME DELTA
WT - RR Tool
Lightweight Risk-Reward Visualization Tool.
Woodie_CCI
The Woodie CCI Indicator (Woodie Commodity Channel Index) is a variation of the classic CCI indicator
Automatic Fibonatti
Automatically plots Fibonacci retracement levels using the highest and lowest points of a customizable time range
Clustering
Clustering tool for traders with visual insights into market patterns.
Pattern Signal Forex
Indicator pattern signal moment
Fibonacci Pitchfan
Powerful all-in-one tool for traders seeking a clear, dynamic view of market structure. By merging pivots, trendlines &