
Laguerre RSI
อินดิเคเตอร์
648 ดาวน์โหลด
เวอร์ชัน 1.0, Oct 2024
Windows, Mac
5.0
รีวิว: 1
คำอธิบาย
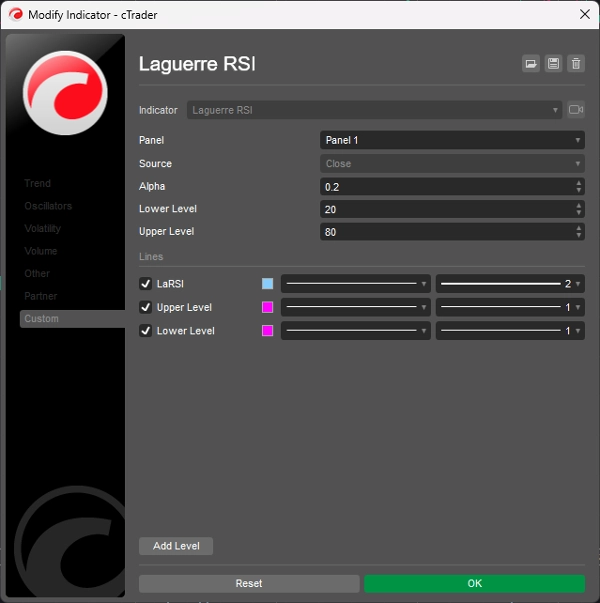
Laguerre RSI อิงตามตัวกรอง Laguerre ของ John EHLERS เพื่อหลีกเลี่ยงเสียงรบกวนของ RSI
เปลี่ยนสัมประสิทธิ์อัลฟาเพื่อเพิ่ม/ลดความล่าช้าและความนุ่มนวล
the
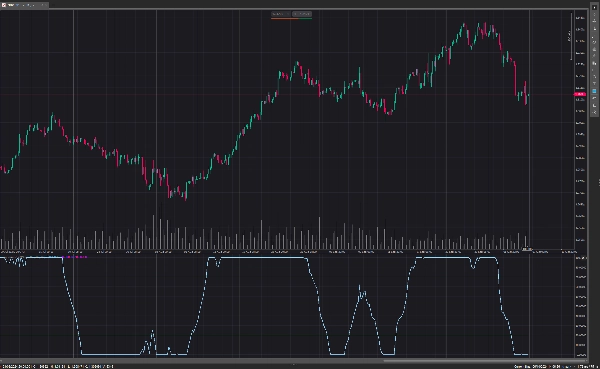
ซื้อเมื่อ Laguerre RSI ตัดขึ้นเหนือ 20
ขายเมื่อ Laguerre RSI ตัดลงต่ำกว่า 80
ในขณะที่ตัวบ่งชี้วิ่งแบนเหนือ 80 แนวโน้มขาขึ้นจะแข็งแกร่ง
ในขณะที่ตัวบ่งชี้วิ่งแบนต่ำกว่า 20 หมายความว่าแนวโน้มขาลงแข็งแกร่ง
สรุป
สรุปโดย AI
Laguerre RSI is a technical indicator based on John Ehlers' Laguerre Filter designed to reduce the noise commonly found in traditional Relative Strength Index (RSI) calculations. It allows users to adjust the alpha coefficient to control the lag and smoothness of the indicator, tailoring its responsiveness to market conditions. The indicator generates buy signals when the Laguerre RSI crosses upward above the 20 level and sell signals when it crosses downward below the 80 level. Additionally, a flat reading above 80 indicates a strong uptrend, while a flat reading below 20 signals a strong downtrend. This indicator is used to identify trend strength and potential entry and exit points by filtering out market noise inherent in standard RSI measurements.
โปรไฟล์อินดิเคเตอร์
รีวิวจากลูกค้า
5.0
รีวิว: 1
5 | 100 % | |
4 | 0 % | |
3 | 0 % | |
2 | 0 % | |
1 | 0 % |
รีวิวจากลูกค้า
July 14, 2025
Pros: Smooths RSI using Laguerre filter, reducing noise and lag. Clear overbought/oversold levels. Great for scalping. Cons: No alerts or tooltips. Requires confirmation with trend filters. Lacks setting templates and advanced features.
การสนทนา
คำถามที่พบบ่อย
RSI
ผลิตภัณฑ์ที่มีให้บริการผ่าน cTrader Store รวมถึงบอทการเทรด อินดิเคเตอร์ และปลั๊กอิน มีให้บริการโดยนักพัฒนาบุคคลที่สามและมีไว้เพื่อวัตถุประสงค์ในการเข้าถึงข้อมูลและทางเทคนิคเท่านั้น cTrader Store ไม่ใช่โบรกเกอร์และไม่ได้ให้คำแนะนำการลงทุน คำแนะนำส่วนบุคคล หรือการรับประกันผลการดำเนินงานในอนาคต
เพิ่มเติมจากผู้เขียนคนนี้


ราคา
2
การขาย
6.9K
ติดตั้งฟรี