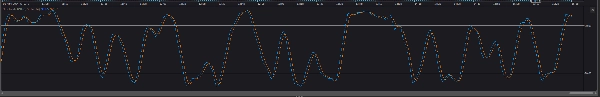
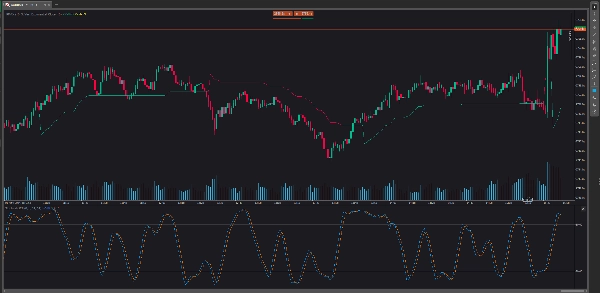
지표
RSI
Indices
StochasticRSI
"StochasticRSI" 로고
5.0
03/09/2025
857
Desktop
"StochasticRSI" 업로드된 이미지"StochasticRSI" 업로드된 이미지"StochasticRSI" 업로드된 이미지

Stochastic RSI (StochRSI) is a technical analysis indicator used to support stock market prediction by comparing a security's price range to its closing price. StochRSI is unique in that it focuses on market momentum and is good at reading overbought and oversold market conditions. StochRSI differs from other technical indicators, such as the Relative Strength Index (RSI), because it moves from overbought to oversold prices faster than the RSI.

5.0
리뷰: 1
5
100 %
4
0 %
3
0 %
2
0 %
1
0 %
고객 리뷰
July 9, 2025
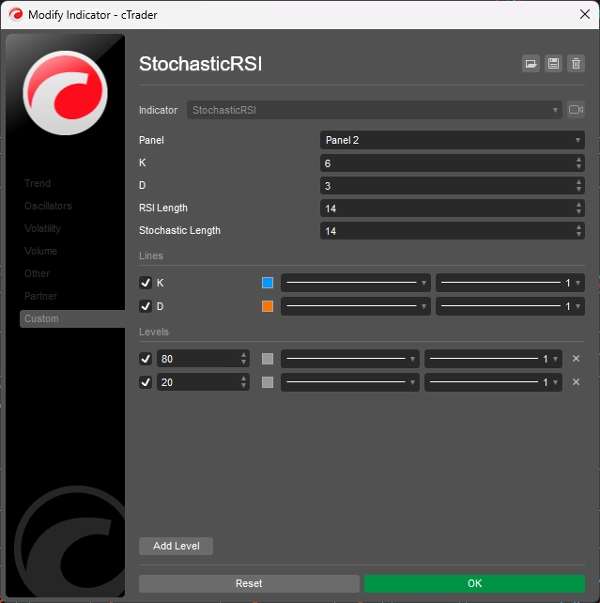
Pros: Combines Stochastic Oscillator and RSI for improved overbought/oversold detection. Easy to set up, stable on all timeframes. Cons: No tooltips or alerts. Requires confirmation from trend indicators to avoid false signals. Limited customization options.
이 작성자의 상품 더 보기
최고 평점
무료
지표
ATR
Supertrend
PMAX
It's a combination of two trailing stop loss and the other one is well-known ATR-based SuperTrend.
cBot
VWAP
RSI
Breakout
+5
Investion X V1.9 - Intelligent Filter-Based Trading System
Trading system combining martingale strategy with multi-layered technical analysis and comprehensive protection features
지표
Indices
AI
Machine Learning Momentum Index
The Machine Learning Momentum Index (MLMI) represents the next step in oscillator trading.
Laguerre RSI
Laguerre RSI is based on John EHLERS' Laguerre Filter to avoid the noise of RSI.
KDJ
The KDJ oscillator display consists of 3 lines (K, D and J - hence the name of the display) and 2 levels.
지표
Breakout
Forex
On Balance Volume
On Balance Volume (OBV) measures buying and selling pressure as a cumulative indicator.
Quantitative Qualitative Estimation
The QQE (Quantitative Qualitative Estimation) Weighted Oscillator improves its original version by weighting the RSI.
지표
Breakout
Stocks
Signal
Darvas Box
The Darvas Box involves identifying "boxes" or trading ranges where a stock's price consolidates before breaking out.
지표
Indices
Breakout
Stocks
+3
Ichimoku Cloud Indicator
The Ichimoku Cloud is a comprehensive technical analysis system developed by Japanese journalist Goichi Hosoda
Chaikin Money Flow
Chaikin money flow's primary purpose is to distinguish between periods of accumulation and distribution of a security.
cBot
Grid
Martingale
Investion Basic
This is a basic martingale bot without an indicator. For long and short trading options at the same bot.
좋아하실 만한 다른 항목
ScalpingSignalIndicator
Scalping signals with EMA/RSI/ATR logic. Visual cloud shows precise entry and exit zones. Built for M1/M5 scalpers.
Risk Reward Guardian Scalping Swing Intraday Assistant
Trade fearlessly: auto-adjusts order blocks, manages risks, and ensures precision.
Dhruvin Wick Candelssss
RSI‑powered robot for high‑volatility scalping, no fuss.
지표
Indices
RSI
Signal
[Stellar Strategies] MARSI Signal Plotter
🚀📈 Plot buy/sell signals on Range Bars using Moving Averages and RSI. Clear, actionable trading insights.🚀📈
지표
RSI
ATR
Signal
+1
Trading Fusion Bars 2
This indicator works best as a trend-confirmation tool—wait for multiple signals!
지표
NAS100
NZDUSD
Martingale
+26
Info Dashboard_noSourceCode
Read the market with AI: live sentiment, news impact, equity, spread & neural net signals in one dashboard.
지표
Prop
Scalping
MM-HTF Bars
Shows bars from different Time Frame on zoom out and hides the current bars. Perfect tool for Multi TF "Market Reply"
지표
NAS100
NZDUSD
XAUUSD
+11
Session HighLow Pivot Points Indicator advanced version
Visualize global trading sessions with colored range boxes. Track New York, London, Tokyo, and Sydney sessions
MTF Candle Window - On Chart
The Multi-Timeframe Candle Indicator displays candles from multiple timeframes in one window, enhancing market analysis!
Session Highlight Framer
Frame the sessions
지표
Indices
Breakout
Prop
+2
Price Change Bundle 1.0 BT
Price Change Bundle 3-in-1 Levels • Bars • Histogram. Secret of Price Change
지표
Indices
Prop
Commodities
+3
Period Separator
Period Separator that shows on all timeframes including renko and range bars.
Simple MACD Histogram
Simple MACD Histogram with color-coded rising (green) and falling (red) momentum bars.
ICT Killzone and Sessions high_low
This indicator is an essential tool for traders seeking to visualize key trading sessions on their charts.
지표
Indices
MFI-MTF
MFI- MTF is a multi-timeframe momentum indicator that brings higher timeframe perspective to your current chart
VixFix
A volatility spike detector based on Larry Williams’ VIX Fix. Highlights market fear moments with clear histogram signal
지표
Indices
RSI
XAUUSD
+7
RSI Divergence
Detects bullish and bearish divergences
지표
Indices
Prop
Forex
+1
Vision - Advanced Session Indicator