
설명
다르바스 박스 이론
다르바스 박스 이론은 1950년대 니콜라스 다르바스가 개발한 거래 기법입니다. 이는 가격 움직임을 이용해 시장에서 잠재적인 진입 및 청산 지점을 식별하는 모멘텀 기반 거래 전략입니다.
다르바스 박스 작동 원리
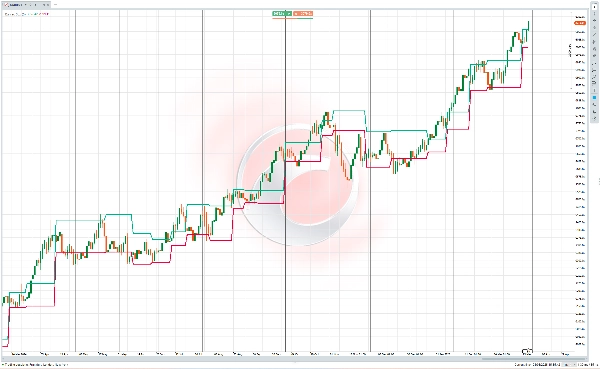
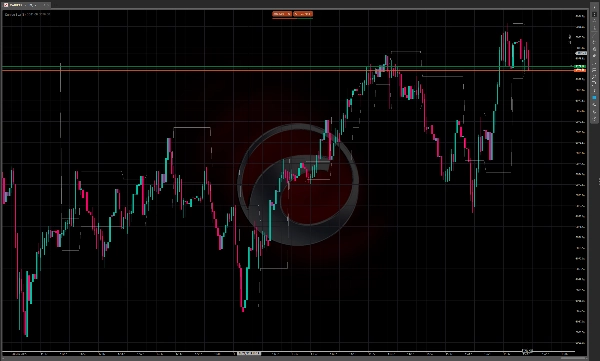
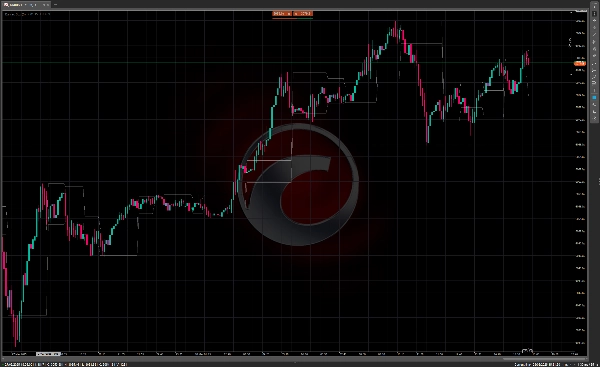
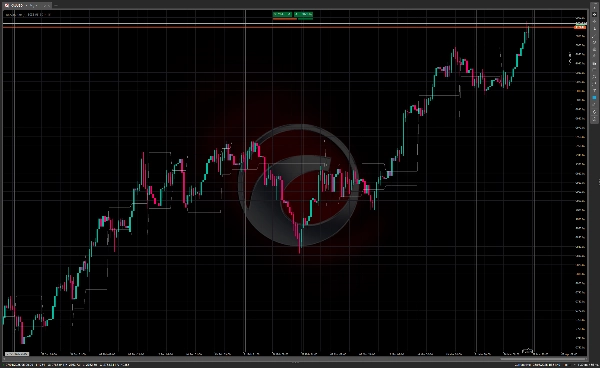
다르바스 박스 방법은 주가가 돌파하기 전에 가격이 통합되는 "박스" 또는 거래 범위를 식별하는 것을 포함합니다. 주요 구성 요소는 다음과 같습니다:
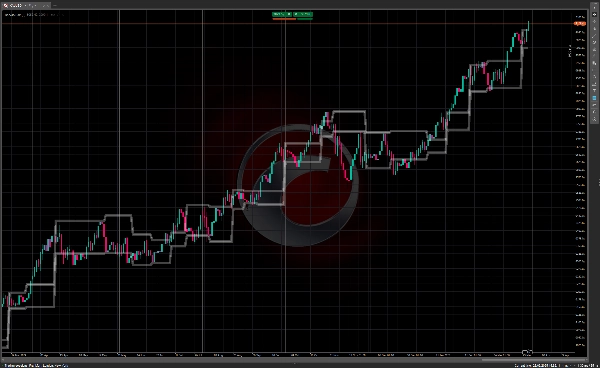
- 가격이 명확한 상한선과 하한선을 가진 정의된 거래 범위("박스")를 형성함
- 상한선은 저항을 나타내고, 하한선은 지지 역할을 함
- 박스 위로의 돌파는 잠재적인 매수 기회를 신호함
- 박스 아래로의 붕괴는 매도 신호로 사용될 수 있음
이 기법을 사용하는 트레이더들은 일반적으로 가격 움직임과 함께 거래량이 증가하는 주식을 찾는데, 이는 돌파 뒤에 더 강한 모멘텀이 있음을 시사합니다.
다르바스 박스 이론의 역사
니콜라스 다르바스(1920-1977)는 거래 역사에서 다소 독특한 인물입니다. 헝가리에서 태어난 그는 전문 트레이더가 아니라 그의 이복 여동생과 함께 "다르바스와 줄리아"라는 무도회 댄스 듀오에서 활동한 무용가였습니다.
1950년대 전 세계를 투어하는 동안 다르바스는 주식 거래를 실험하기 시작했습니다. 그의 상황은 독특했는데, 투어 중 여러 도시에서 배달된 신문에 실린 주식 표만을 기반으로 투자 결정을 내리곤 했습니다.
다르바스는 시행착오를 통해 박스 이론을 개발했습니다. 처음에는 시장에서 손실을 보았지만 점차 접근 방식을 개선했습니다. 1956년부터 1958년 사이에 그는 박스 방법을 사용해 1만 달러의 투자를 200만 달러 이상으로 불렸다고 전해지며, 이는 큰 주목을 받았습니다.
1960년, 다르바스는 자신의 방법을 "How I Made $2,000,000 in the Stock Market"라는 책에 출판했으며, 이 책은 거래 문헌에서 고전이 되었습니다. 이 책은 그의 여정을 상세히 설명하고 박스 이론을 소개하여 이 접근법을 대중에게 알렸습니다.
다르바스 방법이 특히 주목받은 이유는 그 단순함과 금융 업계 외부인이 개발했다는 점이었습니다. 그는 기본적 분석보다는 주로 가격 움직임과 거래량에 집중했으며, 이는 당시에는 다소 새로웠지만 이후 많은 기술적 거래 시스템에 영향을 미쳤습니다.
다르바스 박스 기법은 오늘날에도 기술적 트레이더들 사이에서 인기가 있으며, 특히 추세 시장에서 모멘텀 기반 전략을 따르는 이들에게 선호됩니다.


