
Mô tả
🚀 Hơn 10.000 nhà giao dịch đã sử dụng các chỉ báo hàng đầu của chúng tôi 🏆
👉 Nhận tất cả các hệ thống hàng đầu của chúng tôi tại đây:
_______________________________________________
📌 Chỉ báo Cấu trúc Thị trường
· ✅ AdvancedMarket Structure: Bos, Choch, SwinLevels, Order Blocks, Market Structure& Liquidity Finder
· 🔄 Dynamic Market StructureAnalysis of Turning Points
· 🧱 Order Block
· ⚖️ Market Imbalance
· ⛓️ BOS & CHOCH
· 🧠 ICT Power of 3
_______________________________________________
🔚 Hệ thống Thoát Thông minh
· 📍 Thuật toán Thông minh Theo dõi
_______________________________________________
📐 Chỉ báo ZigZag
· 🔍 ZigZag Price LiquidityProjection
· ➖ ZigZag
· 🎯 Trình theo dõi Cực điểm Zig-Zag
_______________________________________________
🧱 Chỉ báo Hỗ trợ & Kháng cự
· 🟩 SmartTrend Hỗ trợ & Đường Kháng cự
· 🧱 Tất cả các Mức Hỗ trợ và Kháng cự
_______________________________________________
📊 Chỉ báo Xu hướng & Kênh
· 📊 Supertrend
· ⚡Trình phân tích Xu hướng Động lượng
· ⭐ KÊNH SSL CAO CẤP
_______________________________________________
💧 Công cụ Khối lượng & Thanh khoản
· 🔥 Bản đồ Nhiệt POC Khối lượng
· 🔍 Khoảng cách Giá Trị Công bằng Động lượng
· 🕒 Phiên Khoảng cách Giá Trị Công bằng
_______________________________________________
⚡ Chỉ báo Động lượng & RSI
· 🔎 Theo dõi Đa cấp Định hướng Nến
Tracker
_______________________________________________
🔮 Công cụ Dự đoán & Chiếu dự
· 📐 Dự đoán dựa trên Linreg& ATR
· 📏 Hồi quy Tuyến tính Fibonacci Đa khung thời gian
· 📈 Máy chiếu Dòng chảy Thị trường dựa trên Khối lượng
📊 Hệ thống Hồi quy Phá vỡ Squeeze -🚀
🎯 Nó là gì và dùng để làm gì? ❓
Chỉ báo này kết hợp hai hệ thống bổ trợ để xác định các cơ hội giao dịch có xác suất cao:
- Hệ thống Squeeze (Nén Biến động): 🔍 Phát hiện những khoảnh khắc khi thị trường bị "nén" và sắp bùng nổ theo bất kỳ hướng nào 💥
- Hệ thống Kênh Xu hướng (Hồi quy Tuyến tính): 📈 Hiển thị xu hướng chi phối và các giới hạn hỗ trợ/kháng cự động của nó
🔍 Nó hoạt động như thế nào? ⚙️
PHẦN 1: Phát hiện Squeeze
Chỉ báo phân tích khung thời gian cao hơn (mặc định: Hàng ngày) và tìm các cây nến có phạm vi (chênh lệch giữa cao và thấp) nhỏ nhất trong:
• 7 kỳ = "Squeeze Ngắn" (nén ngắn)
• 10 kỳ = "Squeeze Mở rộng" (nén mở rộng - mạnh hơn) 💪
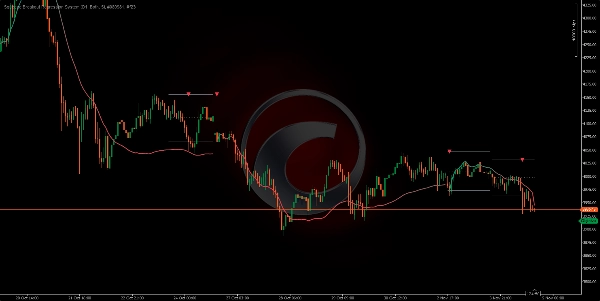
Điều gì xảy ra khi nó phát hiện một Squeeze?
- Nó vẽ ba đường ngang:
o Đường trên = Kháng cự (mức cần phá lên trên) ↗️
o Đường dưới = Hỗ trợ (mức cần phá xuống dưới) ↘️
o Đường chấm giữa = Điểm xoay (điểm giữa) ⚖️ - Nó chờ đợi sự phá vỡ:
o Nếu giá phá kháng cự lên trên → Tín hiệu TĂNG (tam giác xanh) 🟢
o Nếu giá phá hỗ trợ xuống dưới → Tín hiệu GIẢM (tam giác đỏ) 🔴
Bộ lọc thông minh: 🧠
• Đối với tín hiệu tăng: Giá phải ở dưới điểm xoay trước, sau đó tăng lên
• Đối với tín hiệu giảm: Giá phải ở trên điểm xoay trước, sau đó giảm xuống
• Điều này loại bỏ các tín hiệu giả khi giá đã ở xa phạm vi ❌
PHẦN 2: Kênh Xu hướng Hồi quy
Nó tính toán toán học đường xu hướng tối ưu bằng hồi quy tuyến tính và vẽ một kênh động với:
• Đường trung tâm dày (màu xanh nếu tăng, màu đỏ nếu giảm) 🎨
- Cảnh báo Phá vỡ 🚨
Hiển thị Tín hiệu Phá vỡ
• Nó làm gì: Hiển thị/ẩn các tam giác tín hiệu
• Ảnh hưởng: Nếu bạn tắt nó, bạn sẽ không thấy các mũi tên nhưng các hộp và đường vẫn hiển thị
• Khuyến nghị: Luôn bật ✅
Màu Phá vỡ Tăng/Giảm
• Nó làm gì: Thay đổi màu của các tín hiệu tăng/giảm
• Ảnh hưởng: Chỉ ảnh hưởng về mặt hình ảnh, không ảnh hưởng đến phát hiện
• Khuyến nghị: Màu xanh cho tăng, màu đỏ cho giảm (mặc định) 🟢🔴 - Kênh Xu hướng (Trend Channel) 📊
Phương pháp Kênh
• Tùy chọn: Cuộn / Tĩnh
• Nó làm gì:
o Cuộn: Kênh thích ứng từng thanh (linh hoạt) 🔄
o Tĩnh: Kênh được vẽ một lần khi bắt đầu kỳ và kéo dài (đường thẳng) ➖
• Ảnh hưởng: Cuộn năng động hơn, Tĩnh rõ ràng hơn để thấy xu hướng ban đầu
• Khuyến nghị: Cuộn để theo dõi thời gian thực ⌚
Loại Mỏ neo
• Tùy chọn: Định kỳ / Thanh đầu tiên
• Nó làm gì:
o Định kỳ: Đặt lại phép tính mỗi kỳ mới (tuần, tháng, v.v.) 📅
o Thanh đầu tiên: Tính từ thanh đầu tiên trên biểu đồ (không bao giờ đặt lại) 🏁
• Ảnh hưởng: Định kỳ cho kênh sạch mỗi kỳ, Thanh đầu tiên cho xu hướng tổng thể
• Khuyến nghị: Định kỳ cho phân tích có cấu trúc 🧱
Kỳ Kênh
• Nó làm gì: Tần suất đặt lại phép tính kênh
• Mặc định: Hàng tuần (Weekly) 🗓️
• Ảnh hưởng:
o Kỳ ngắn (Hàng ngày) → Kênh thay đổi thường xuyên, theo kịp biến động nhanh
o Kỳ dài (Hàng tháng) → Kênh ổn định hơn, thể hiện xu hướng nền
• Khuyến nghị: Hàng tuần là sự cân bằng hoàn hảo ⚖️
Nguồn Giá
• Tùy chọn: Đóng / Mở / Cao / Thấp / Điển hình / Trọng số
• Nó làm gì: Giá được sử dụng để tính kênh
• Ảnh hưởng: Đóng là phổ biến nhất (giá đóng cửa), Điển hình làm mượt phép tính
• Khuyến nghị: Đóng cho độ chính xác, Điển hình cho làm mượt 🎯
Hệ số Độ lệch
• Nó làm gì: Nhân độ lệch chuẩn để làm kênh rộng hơn hoặc hẹp hơn
• Mặc định: 1.0
• Ảnh hưởng:
o Giá trị thấp (0.5-0.8) → Kênh hẹp, nhiều tín hiệu chạm nhưng cũng nhiều tín hiệu sai
o Giá trị cao (1.5-2.0) → Kênh rộng, ít chạm nhưng đáng tin cậy hơn
• Khuyến nghị: 1.0 là sự cân bằng tối ưu ⚖️ - Màu sắc Kênh 🎨
Màu sắc Động
• Nó làm gì: Thay đổi màu kênh theo xu hướng (xanh nếu tăng, đỏ nếu giảm)
• Ảnh hưởng: Nếu tắt, chỉ dùng một màu (Màu Xu hướng Tăng)
• Khuyến nghị: Bật để nhanh chóng nhận diện xu hướng 🚦
Màu Xu hướng Tăng/Giảm
• Nó làm gì: Xác định màu cho xu hướng tăng/giảm
• Ảnh hưởng: Chỉ ảnh hưởng hình ảnh
• Khuyến nghị: Xanh/Đỏ (cổ điển) 🟢🔴
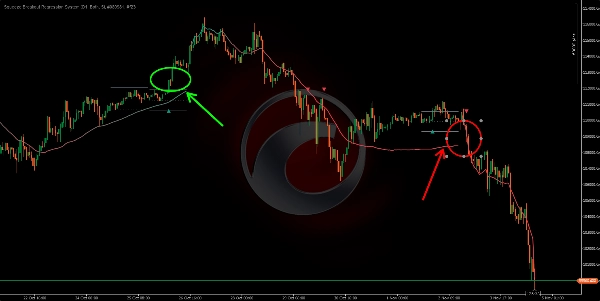
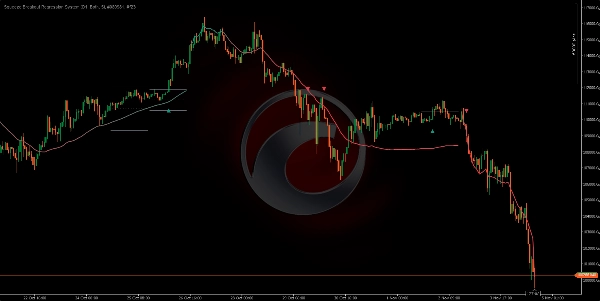
🟢 HOẠT ĐỘNG MUA DÀI HẠN 📈
- Phát hiện Squeeze:
• Ba đường ngang xuất hiện (hỗ trợ, điểm xoay, kháng cự)
• Giá bị nén giữa các mức này - Chuẩn bị Phá vỡ:
• Giá nằm dưới điểm xoay (đường chấm giữa)
• Điều này kích hoạt điều kiện tìm kiếm phá vỡ tăng - ĐIỂM HỘI TỤ CHÍNH - Thời điểm vào lệnh: 🎯
• ✅ Tam giác xanh xuất hiện (xác nhận phá vỡ tăng) 🟢
• ✅ Kênh Hồi quy có màu XANH (xác nhận xu hướng tăng) 📗
• ✅ Giá phá vỡ đường squeeze trên ↗️
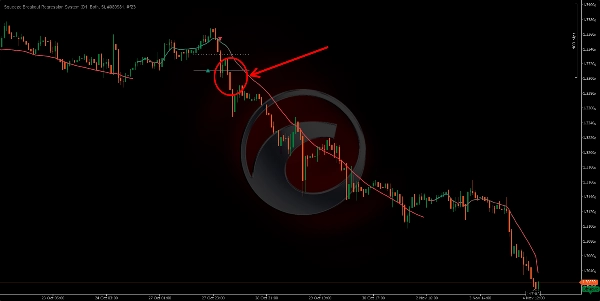
🔴 HOẠT ĐỘNG BÁN NGẮN HẠN 📉
- Phát hiện Squeeze:
• Ba đường ngang xuất hiện lại
• Xác định vùng nén mới - Chuẩn bị Phá vỡ Giảm:
• Giá nằm trên điểm xoay (đường chấm)
• Điều này kích hoạt tìm kiếm phá vỡ giảm - ĐIỂM HỘI TỤ CHÍNH - Thời điểm vào lệnh: 🎯
• ✅ Tam giác đỏ xuất hiện (xác nhận phá vỡ giảm) 🔴
• ✅ Kênh Hồi quy có màu ĐỎ (xác nhận xu hướng giảm) 📕
• ✅ Giá phá vỡ đường squeeze dưới ↘️
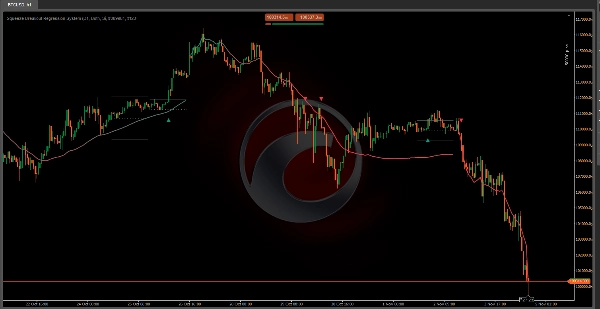
Tóm tắt
The Trend Channel System uses linear regression to calculate the dominant trend and dynamically draws a channel with color-coded trend direction (green for uptrend, red for downtrend). It offers configurable options such as rolling or static channels, periodic or continuous anchoring, channel period, price source, and deviation multiplier to adjust channel width and responsiveness.
The indicator supports breakout alerts with visual signals for bullish and bearish breakouts, aiding traders in timing entries. It is applicable across various markets including Forex, cryptocurrencies, stocks, and indices, with symbols like BTCUSD, EURUSD, GBPUSD, XAUUSD, NAS100, and USDJPY. The system integrates volatility compression detection with trend analysis to assist in identifying breakout trading opportunities.


