


Descrição
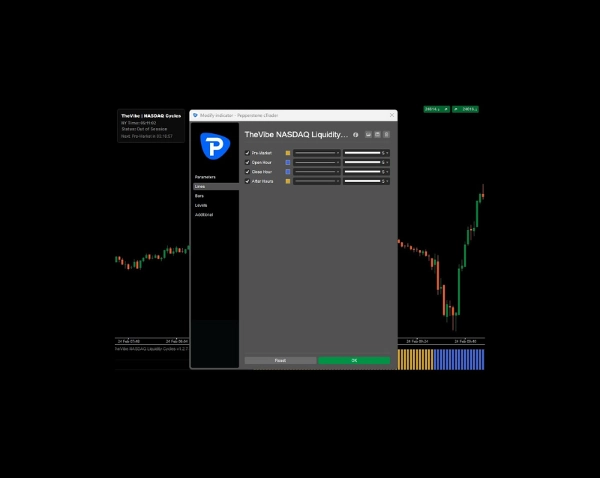
TheVibe NASDAQ Liquidity Cycles é um realçador de sessão profissional projetado especificamente para o NASDAQ 100. Ele elimina a necessidade de rastrear manualmente as diferenças de fuso horário ou adivinhar quando o volume vai aumentar, colocando as horas exatas do mercado de Nova York visualmente bem na sua frente.
Como a lógica é baseada no tempo absoluto em vez de contagem de barras, este indicador é completamente independente do período de tempo — funcionando perfeitamente, seja você fazendo scalping em um gráfico de 1 minuto ou swing trading em um gráfico de 1 hora.
Para quem é & Como Usar: Este indicador é feito para day traders e traders de momentum que dependem de temporização precisa e volatilidade impulsionada puramente pelo volume para suas operações.
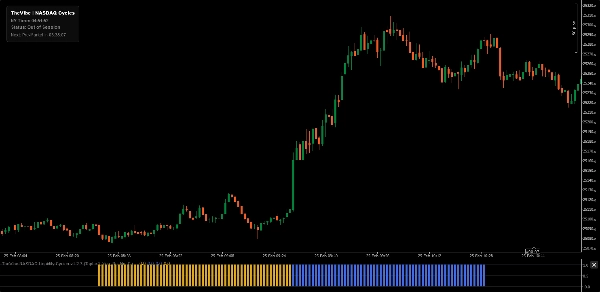
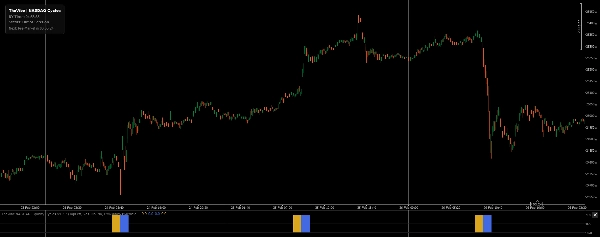
- Interpretação: O indicador plota blocos sólidos de histograma codificados por cores na subjanela sempre que uma sessão chave de liquidez está ativa. Ao ter esses dados de temporização mapeados visualmente na sua tela, você pode alinhar facilmente seu trading com janelas de alta probabilidade e evitar períodos instáveis e de baixa liquidez sem nunca precisar consultar um relógio externo.
Fases Principais de Liquidez Monitoradas:
- Pré-Mercado (8:30 AM - 9:30 AM NY): A hora institucional do Pré-Mercado, focando em notícias de alto impacto e posicionamento antecipado.
- Hora de Abertura (9:30 AM - 10:30 AM NY): A janela de volatilidade do toque da campainha de abertura, essencial para a descoberta inicial de preços e influxo de volume.
- Hora de Fechamento (3:00 PM - 4:00 PM NY): A "Hora do Poder" e cruzamento de fechamento, destacando o momentum institucional do final do dia e o ajuste de posições.
- Após o Expediente (4:00 PM - 5:00 PM NY): A hora de liquidação pós-mercado, capturando a fase final de liquidez conforme o trading padrão termina.
Principais Recursos:
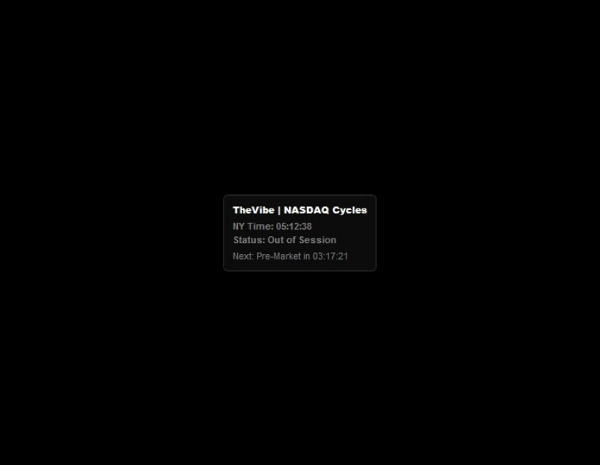
- Painel Interativo de Contagem Regressiva: Um HUD dinâmico no gráfico que exibe a hora exata de Nova York, sua sessão ativa atual e uma contagem regressiva ao vivo para a próxima janela de liquidez.
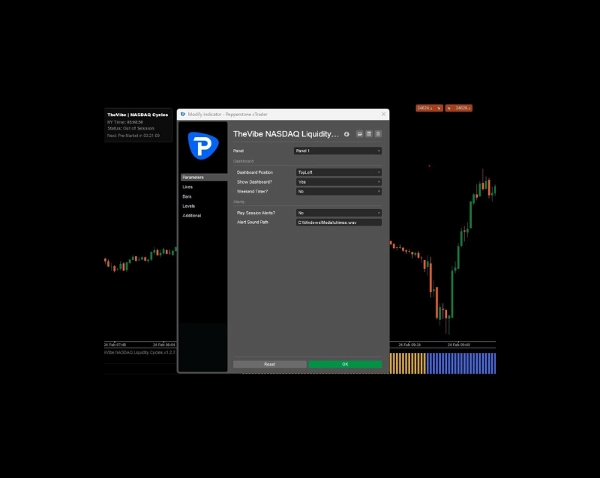
- Posicionamento Dinâmico: Fixe o painel em qualquer um dos quatro cantos do seu gráfico (padrão no canto inferior esquerdo) para manter sua ação de preço completamente desobstruída.
- Motor Avançado de Fuso Horário: Sincroniza automaticamente seu horário local ou do servidor do corretor com a hora exata de Nova York (lida automaticamente com EST/EDT).
- Lógica Inteligente para Fim de Semana: Escolha ocultar a contagem regressiva durante o fim de semana ou exibir os dias e horas exatos restantes até a abertura do Pré-Mercado na segunda-feira.
- Alertas Sonoros: Toques de notificação opcionais que disparam no exato momento em que uma janela de liquidez alvo abre ou fecha.
Recomendação de Exibição: Para uma gestão ideal do espaço de trabalho, ajuste a altura da subjanela do indicador para um tamanho compacto. Isso oferece uma "barra de ritmo" clara e discreta da liquidez do dia, preservando o máximo de espaço na tela para seu gráfico principal de preços.
Nota: O temporizador automático de contagem regressiva assume o horário padrão de negociação de segunda a sexta-feira e não considera automaticamente feriados públicos dos EUA ou fechamentos antecipados do mercado.
Resumo
This timeframe-agnostic tool works across all chart intervals, from 1-minute scalping to 1-hour swing trading. It features an interactive countdown dashboard displaying current New York time, active session, and time remaining until the next liquidity window. The dashboard can be positioned in any chart corner to avoid obstructing price data. An advanced timezone engine synchronizes local or broker server time with New York time, automatically adjusting for EST/EDT. Additional features include smart weekend logic to manage countdown display and optional audio alerts signaling session openings and closings.
The indicator is intended for day and momentum traders relying on volume-driven volatility and precise timing. For optimal use, it is recommended to keep the sub-window compact to maintain chart clarity.
Avaliações de clientes
5 | 25 % | |
4 | 75 % | |
3 | 0 % | |
2 | 0 % | |
1 | 0 % |
Conversa
Perguntas frequentes
Também poderá gostar de


















Preço