
Chaikin Money Flow
Indicador
130 transferências
Versão 1.0, Dec 2024
Windows, Mac
5.0
Avaliações: 1
Descrição
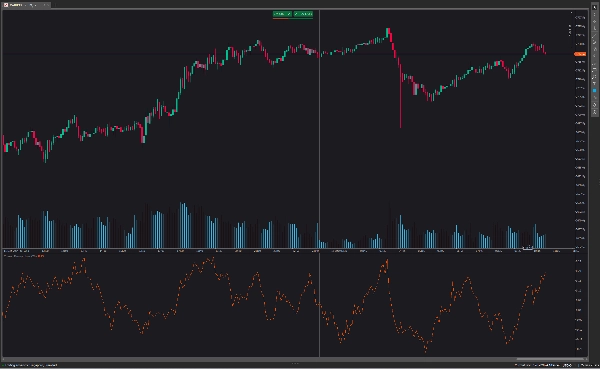
O principal objetivo do fluxo de dinheiro de Chaikin é distinguir entre períodos de acumulação e distribuição de um ativo. Quando o indicador está acima da linha zero, indica que o ativo está passando por acumulação líquida, sugerindo que os investidores estão comprando o ativo.
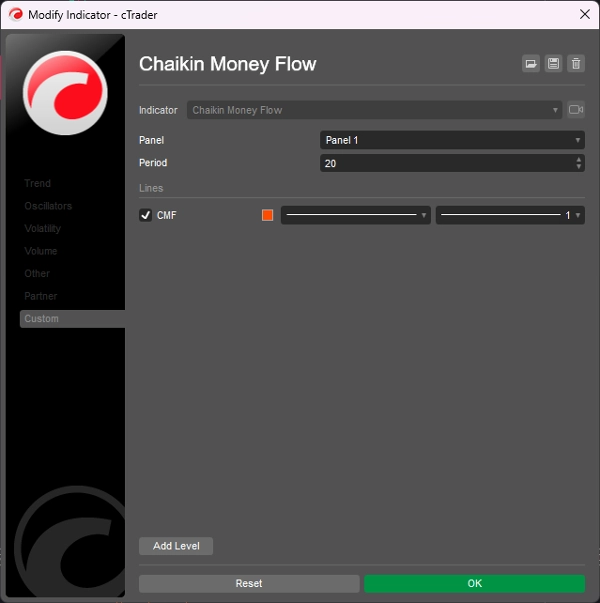
- Configurações do Chaikin Money Flow com valores acima de 30 tornam o indicador menos sensível. Isso resultará em sinais menos frequentes, mas de melhor qualidade.
- Configurações do Chaikin Money Flow com valores abaixo de 20 tornam o indicador excessivamente sensível. Isso resultará em mais ruído de mercado.
- Indica uma tendência de alta contínua quando o indicador CMF cruza a linha zero de cima para baixo e gera sinais de compra/longos.
- Indica uma tendência de baixa contínua quando o indicador CMF cruza a linha zero de baixo para cima e gera sinais de venda/curtos.
Resumo
Resumo de IA
The Chaikin Money Flow (CMF) indicator is designed to identify periods of accumulation and distribution for a security. When the CMF value is above zero, it signals net accumulation, indicating buying pressure. Conversely, values below zero suggest distribution or selling pressure. The indicator’s sensitivity can be adjusted: settings above 30 reduce sensitivity, producing fewer but higher-quality signals, while settings below 20 increase sensitivity, resulting in more market noise. Key signals include a continued uptrend when the CMF crosses the zero line from above, generating buy signals, and a continued downtrend when it crosses from below, generating sell signals. This tool helps traders assess buying and selling momentum to inform trading decisions.
Perfil do indicador
Avaliações de clientes
5.0
Avaliações: 1
5 | 100 % | |
4 | 0 % | |
3 | 0 % | |
2 | 0 % | |
1 | 0 % |
Avaliações de clientes
August 18, 2025
Reliable volume-based trend confirmation, easy to read, customizable period. Cons: No alerts, no MTF analysis, limited filtering options.
Conversa
Perguntas frequentes
Os produtos disponíveis através da cTrader Store, incluindo bots de negociação, indicadores e plugins, são fornecidos por programadores terceiros e são disponibilizados apenas para fins informativos e de acesso técnico. A cTrader Store não é um corretor e não fornece aconselhamento em matéria de investimento, recomendações pessoais ou qualquer garantia de desempenho no futuro.
Mais deste autor


Preço
2
Vendas
6.9K
Instalações gratuitas