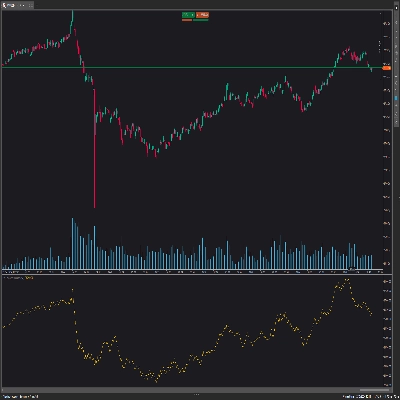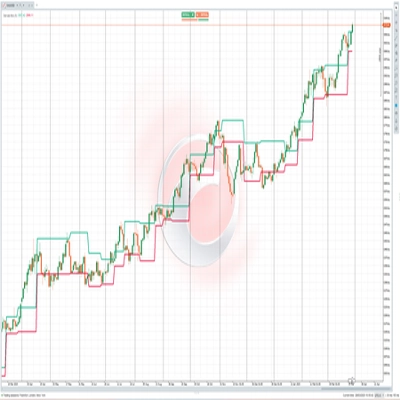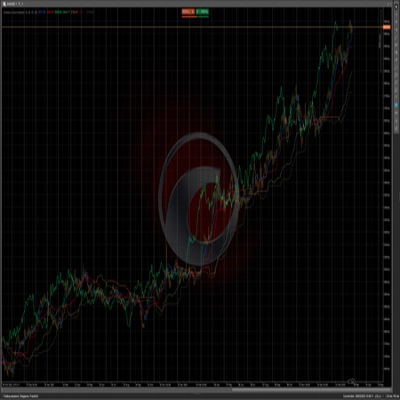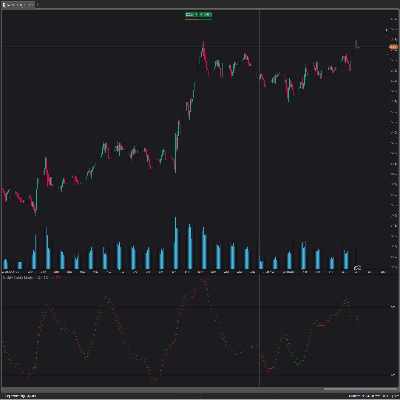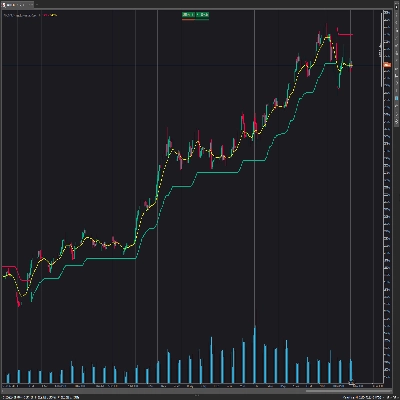
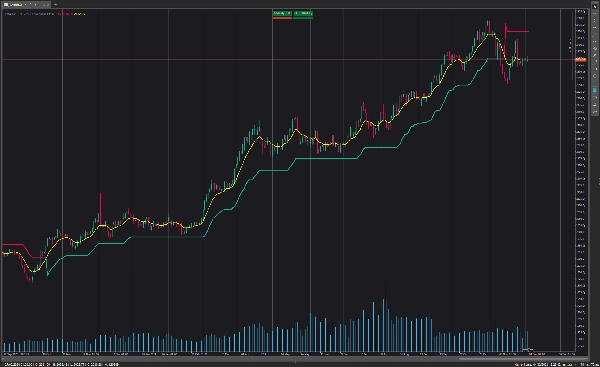
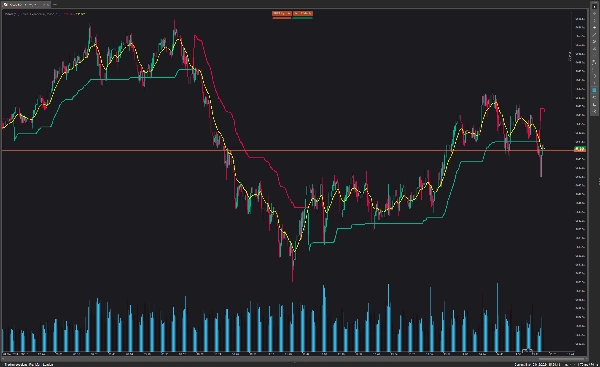
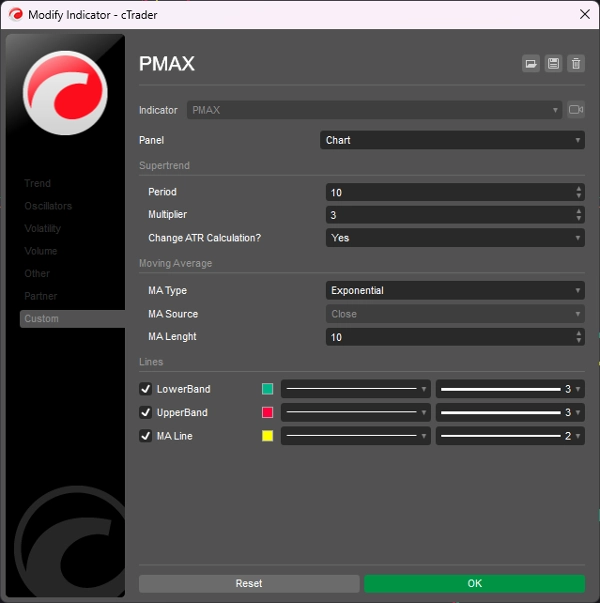

Descrição
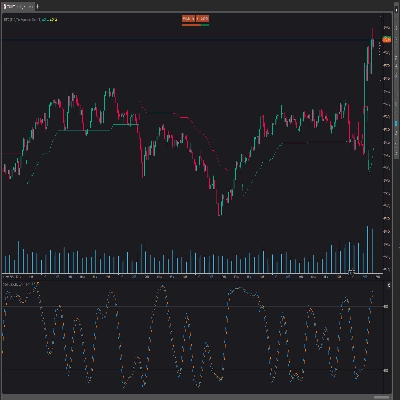
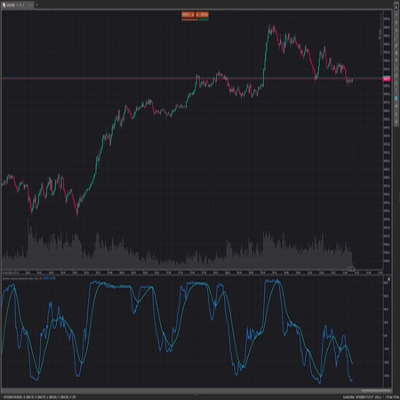
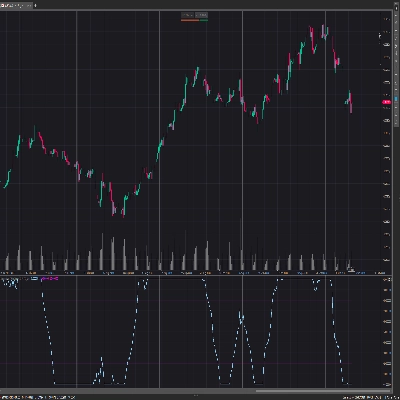
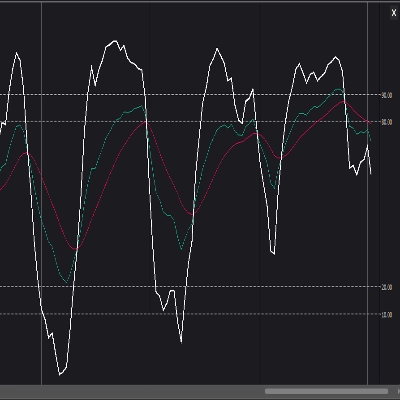
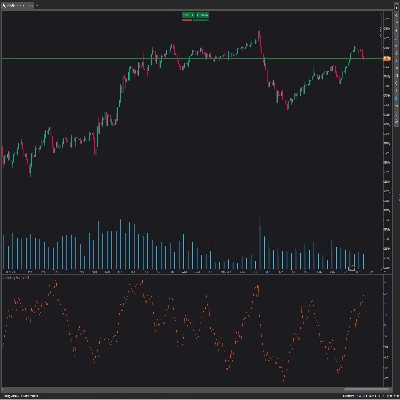
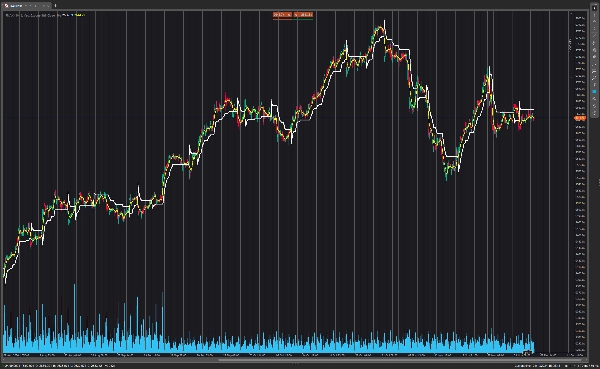
PMax (Maximizador de Lucro) é um indicador totalmente novo desenvolvido por KivancOzbilgic no início de 2020.
É uma combinação de dois indicadores de stop loss móvel;
Um é o MOST (Moving Stop Loss) de Anıl Özekşi e o outro é o conhecido SuperTrend baseado em ATR.
Tanto os indicadores MOST quanto SuperTrend são muito bons em sistemas de seguimento de tendência, mas, inversamente, seu desempenho não é bom em condições de mercado lateralizadas, como a maioria dos outros indicadores.
O Maximizador de Lucro - PMax tenta resolver esse problema. PMax combina os pontos fortes do MOST (Mudança de Tendência da Média Móvel) e do SuperTrend (detecção de preço ATR) em um único indicador.
Os resultados de backtest e otimização do PMax são muito melhores quando comparados aos seus predecessores MOST e SuperTrend. Ele reduz o número de sinais falsos em mercados lateralizados e fornece sinais de negociação mais confiáveis.
PMax é fácil para determinar a tendência e pode ser usado em qualquer tipo de mercado e instrumento. Ele não redesenha.
Resumo
This combination enhances trend identification and reduces false signals during non-trending market phases. Backtesting and optimization show that PMax outperforms its component indicators in reliability and signal accuracy. It is designed for use across various markets and instruments and does not repaint, providing consistent signals for traders.
Avaliações de clientes
5 | 100 % | |
4 | 0 % | |
3 | 0 % | |
2 | 0 % | |
1 | 0 % |