present
Registe-se e receba 50 $ de desconto na sua primeira compra
Trading product for Machine Learning Momentum Index Indicador Indices AI, image 1
Machine Learning Momentum Index
4.5
Avaliações: 2
2
Vendas
7.3K
Instalações gratuitas

Descrição

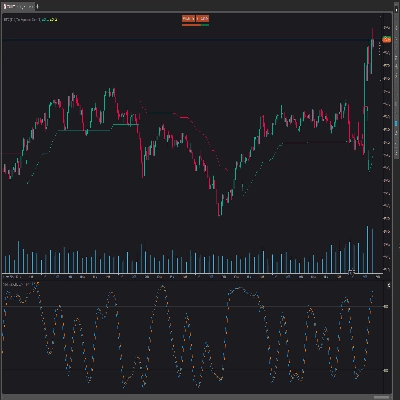
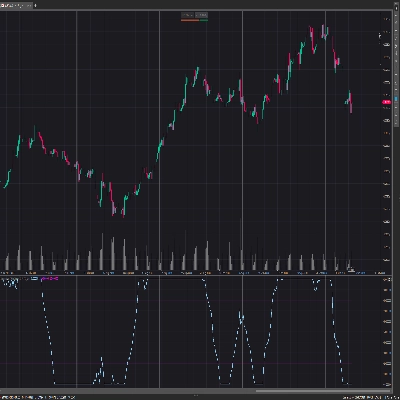
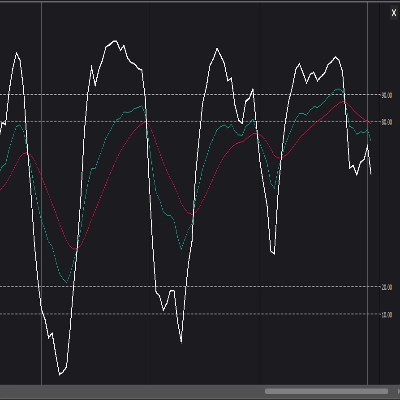
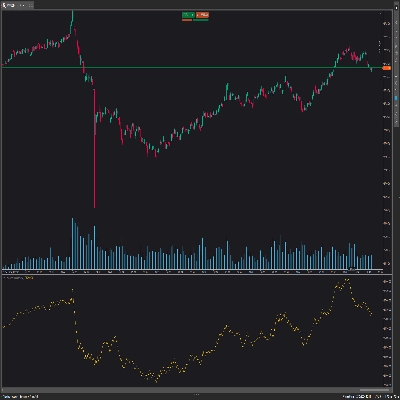
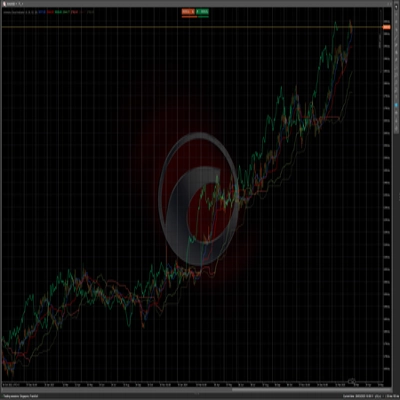
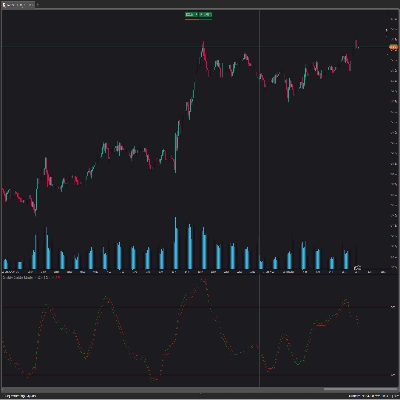
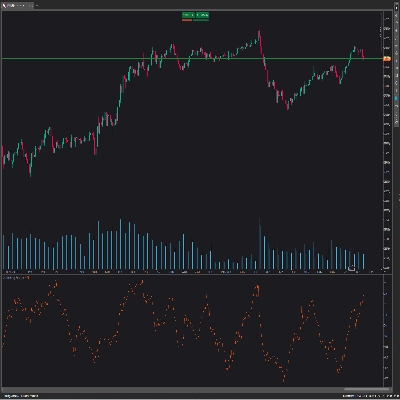
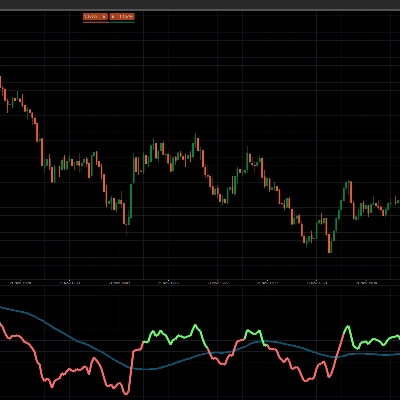
O Índice de Momentum de Aprendizado de Máquina (MLMI) representa o próximo passo na negociação com osciladores. Ao combinar a análise tradicional de momentum com aprendizado de máquina, o MLMI oferece uma ferramenta potente e dinâmica que se alinha às complexidades dos cenários financeiros modernos. Oferecendo aos traders uma forma adaptativa de entender e agir sobre o momentum e as tendências do mercado, este oscilador fornece insights em tempo real sobre o momentum do mercado e as tendências predominantes

Resumo

Resumo de IA
The Machine Learning Momentum Index (MLMI) is an advanced oscillator that integrates traditional momentum analysis with machine learning techniques. Designed to provide real-time insights, MLMI helps traders assess market momentum and identify prevailing trends dynamically. By adapting to the complexities of modern financial markets, this indicator offers an enhanced approach to momentum trading. It is applicable across various indices, including Nasdaq, S&P 500, DAX, and Dow, supporting traders in making informed decisions based on evolving market conditions.
Perfil do indicador

Conversa

Avaliações de clientes

4.5
Avaliações: 2
5
50 %
4
50 %
3
0 %
2
0 %
1
0 %
Avaliações de clientes
July 9, 2025
Pros: Combines RSI-based WMAs and k‑NN machine learning for adaptive momentum detection. Highlights trend changes and consolidation zones. Cons: No alerts or tooltips. Less effective on higher timeframes. Requires other confirmation tools to trade reliably.
April 26, 2025
Accuracy

Perguntas frequentes

Indices
AI
Os produtos disponíveis através da cTrader Store, incluindo bots de negociação, indicadores e plugins, são fornecidos por programadores terceiros e são disponibilizados apenas para fins informativos e de acesso técnico. A cTrader Store não é um corretor e não fornece aconselhamento em matéria de investimento, recomendações pessoais ou qualquer garantia de desempenho no futuro.

Mais deste autor
Logótipo de "PMAX"
5.0
(6)
Grátis
It's a combination of two trailing stop loss and the other one is well-known ATR-based SuperTrend.
Stochastic RSI (StochRSI) is a technical indicator used to measure the strength and weakness of the RSI.
Laguerre RSI is based on John EHLERS' Laguerre Filter to avoid the noise of RSI.
The KDJ oscillator display consists of 3 lines (K, D and J - hence the name of the display) and 2 levels.
The Darvas Box involves identifying "boxes" or trading ranges where a stock's price consolidates before breaking out.
On Balance Volume (OBV) measures buying and selling pressure as a cumulative indicator.
The Ichimoku Cloud is a comprehensive technical analysis system developed by Japanese journalist Goichi Hosoda
The QQE (Quantitative Qualitative Estimation) Weighted Oscillator improves its original version by weighting the RSI.
Chaikin money flow's primary purpose is to distinguish between periods of accumulation and distribution of a security.

Também poderá gostar de

Market structure signals graded A to C, each with a drawn trade plan, plus an adaptive trend ribbon and a trend matrix
COT Flows. Clear Direction. 🧭
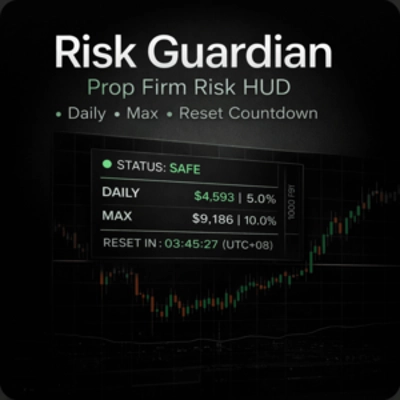
A clean, real-time risk HUD designed to prevent prop firm account failure and protect your challenge account.
Overbought Oversold Indicator
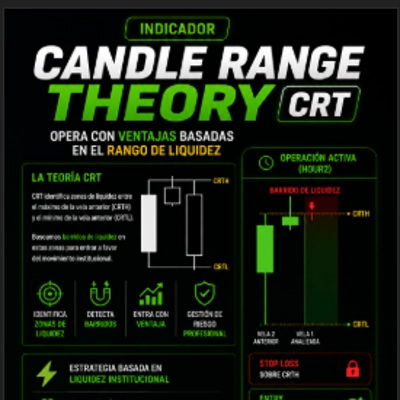
CRT Sweep Tracker is an advanced panel for Candle Range Theory (CRT) traders to track HTF sweeps and manage live trades.
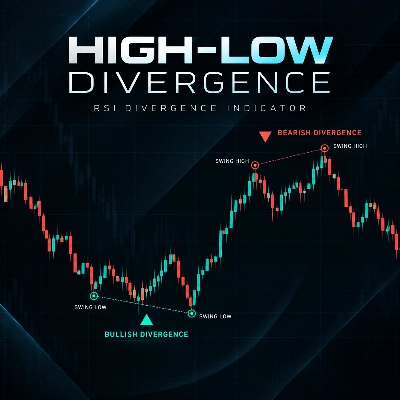
High Low Divergence is a clean, overlay indicator that automatically identifies swing highs and swing lows
Multi-Time Frame Candlesticks FVG with BSL/SSL Premium Suite
INDICATOR,LIQUIDITY POOLS,ACCURATE SIGNAL, NO DELAY,80% PROBABILITY
Tracks NY, London, Tokyo, Sydney sessions with custom visuals, and a real-time expanding range box and breakout High/Low
Plots automatic psychological levels at round-number zones – major structure & liquidity levels.
Multi-anchor VWAP indicator for cTrader. Plots two VWAP lines (red and blue) with selectable anchors.
Entry Momentum MACD Power Guide
Visualize trends with Standard Deviation Channel! Display median, and add customizable upper/lower deviation channels.
Custom and native timeframes display with OHLC lines, moving averages, and Fibonacci levels.
AI-powered daily range forecasts help traders spot volatility opportunities and plan stops and targets.
Multi Timeframe Trend Scanner 🔍 EMA+RSI+ATR heatmap with clear BUY/SELL bias from M5 up to D1.
Candle timer with live profit tracking on chart – displays pips, currency value, and percentage in real time.
Smart Money Concepts (SMC) indicator with real-time Fair Value Gap (FVG) boxes, $50 round numbers, and live market HUD.

Preço

2
Vendas
7.3K
Instalações gratuitas