
Descrição
O Guia Abrangente para Análise da Nuvem Ichimoku
História e Contexto
O Ichimoku Kinko Hyo (ou Nuvem Ichimoku) foi desenvolvido pelo jornalista japonês Goichi Hosoda no final da década de 1930. Após anos de pesquisa e testes retrospectivos com uma equipe de assistentes, Hosoda divulgou suas descobertas em 1969. O nome "Ichimoku Kinko Hyo" traduz-se como "gráfico de equilíbrio de um olhar", refletindo seu propósito: permitir que os traders avaliem rapidamente múltiplos aspectos da ação do mercado em uma única visão.
A inovação de Hosoda foi notável, pois ele criou este sistema complexo décadas antes da análise por computador estar disponível, realizando todos os cálculos manualmente. O que torna o sistema Ichimoku único é sua abordagem holística, integrando múltiplos períodos de tempo e dimensões da análise de mercado em uma estrutura unificada.
Os Cinco Componentes da Nuvem Ichimoku
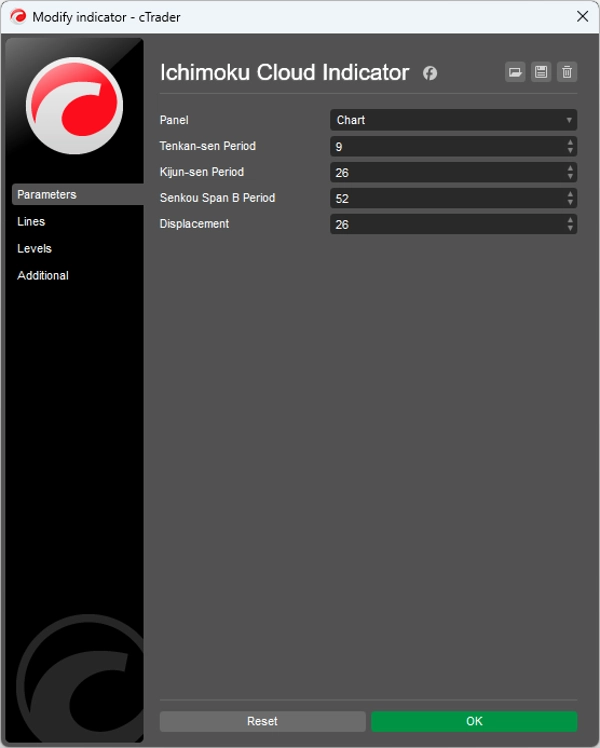
A Nuvem Ichimoku consiste em cinco linhas distintas, cada uma fornecendo insights específicos:
1. Tenkan-sen (Linha de Conversão)
- Cálculo: (Máxima mais alta + Mínima mais baixa) / 2 nos últimos 9 períodos
- Função: Representa o momentum de curto prazo do mercado
- Interpretação: Atua como um nível dinâmico de suporte/resistência e indicador de tendência
2. Kijun-sen (Linha Base)
- Cálculo: (Máxima mais alta + Mínima mais baixa) / 2 nos últimos 26 períodos
- Função: Representa o momentum de médio prazo do mercado
- Interpretação: Atua como um nível mais forte de suporte/resistência e pode servir como stop móvel
3. Senkou Span A (Span Líder A)
- Cálculo: (Tenkan-sen + Kijun-sen) / 2, plotado 26 períodos à frente
- Função: Forma a borda líder da nuvem (Kumo)
- Interpretação: Nível projetado de suporte/resistência
4. Senkou Span B (Span Líder B)
- Cálculo: (Máxima mais alta + Mínima mais baixa) / 2 nos últimos 52 períodos, plotado 26 períodos à frente
- Função: Forma a borda traseira da nuvem (Kumo)
- Interpretação: Nível projetado de suporte/resistência
5. Chikou Span (Span de Retardo)
- Cálculo: Preço de fechamento atual, plotado 26 períodos atrás
- Função: Confirma tendências e identifica potenciais reversões
- Interpretação: Quando acima da ação do preço, é alta; quando abaixo, é baixa
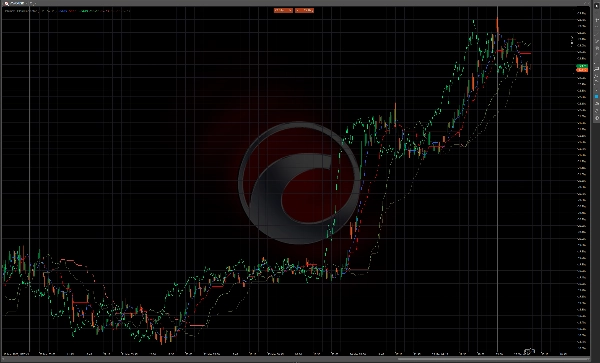
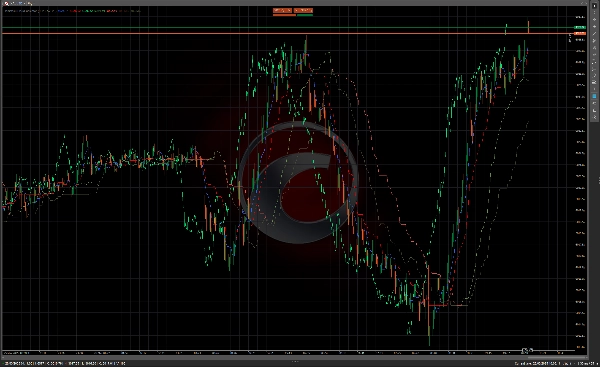
O Kumo (Nuvem)
A área entre Senkou Span A e Senkou Span B é chamada de "Kumo" ou nuvem. A nuvem representa zonas potenciais de suporte e resistência e sua espessura indica a volatilidade do mercado e a força dessas zonas.
- Nuvem Espessa: Suporte/resistência forte, maior volatilidade
- Nuvem Fina: Suporte/resistência mais fraco, menor volatilidade
- Nuvem de Alta: Senkou Span A acima do Senkou Span B (frequentemente colorida de verde)
- Nuvem de Baixa: Senkou Span B acima do Senkou Span A (frequentemente colorida de vermelho)
Regras e Sinais de Negociação
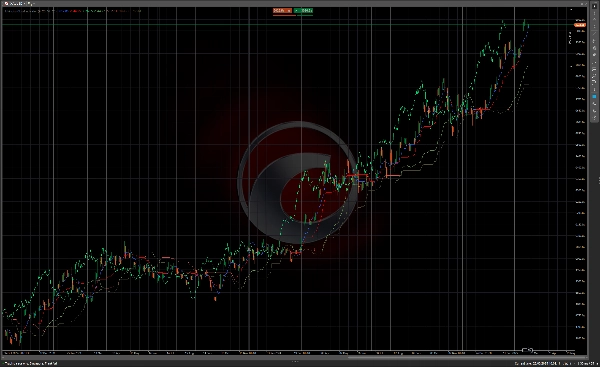
Determinação da Tendência
- Critérios para Tendência de Alta:
-
- O preço está acima da nuvem
- Tenkan-sen está acima do Kijun-sen
- Chikou Span está acima do preço de 26 períodos atrás
- Senkou Span A está subindo e acima do Senkou Span B (nuvem de alta)
- Critérios para Tendência de Baixa:
-
- O preço está abaixo da nuvem
- Tenkan-sen está abaixo do Kijun-sen
- Chikou Span está abaixo do preço de 26 períodos atrás
- Senkou Span A está caindo e abaixo do Senkou Span B (nuvem de baixa)
- Mercado Neutro/Em Faixa:
-
- O preço está dentro da nuvem
- Tenkan-sen e Kijun-sen estão planos ou frequentemente cruzando
Sinais de Entrada
Sinais de Entrada de Alta
- Cruzamento TK (Cruzamento Tenkan/Kijun):
-
- Tenkan-sen cruza acima do Kijun-sen
- Mais eficaz quando o preço está acima da nuvem
- Sinal mais forte quando a nuvem está em alta
- Rompimento da Nuvem (Kumo Breakout):
-
- O preço rompe acima da nuvem após estar abaixo ou dentro dela
- Sinal mais forte quando a nuvem à frente está em alta (Senkou Span A > Senkou Span B)
- Confirmação do Chikou Span:
-
- Chikou Span cruza acima do preço de 26 períodos atrás
- Sem resistência à frente para o Chikou Span
Sinais de Entrada de Baixa
- Cruzamento TK (Baixa):
-
- Tenkan-sen cruza abaixo do Kijun-sen
- Mais eficaz quando o preço está abaixo da nuvem
- Sinal mais forte quando a nuvem está em baixa
- Rompimento da Nuvem (Baixa):
-
- O preço rompe abaixo da nuvem após estar acima ou dentro dela
- Sinal mais forte quando a nuvem à frente está em baixa (Senkou Span B > Senkou Span A)
- Confirmação do Chikou Span (Baixa):
-
- Chikou Span cruza abaixo do preço de 26 períodos atrás
- Sem suporte à frente para o Chikou Span
Sinais de Saída
- Reversão de Tendência: Quando os critérios para a tendência oposta começam a aparecer
- Cruzamento TK: Quando Tenkan-sen cruza Kijun-sen na direção oposta
- Toque na Nuvem: Quando o preço toca o lado oposto da nuvem
- Aviso do Chikou Span: Quando o Chikou Span se aproxima de níveis históricos de preço
Níveis de Suporte e Resistência
- Suporte/Resistência Imediata: Tenkan-sen e Kijun-sen
- Suporte/Resistência de Médio Prazo: A nuvem (mais forte em seções planas)
- Torção do Kumo: Quando Senkou Span A e B se cruzam, criando pontos potenciais de reversão
Técnicas Avançadas do Ichimoku
1. Torção do Kumo (Torção da Nuvem)
Uma Torção do Kumo ocorre quando Senkou Span A e B se cruzam, criando um ponto potencial de reversão 26 períodos no futuro. Traders frequentemente usam isso como um sinal de alerta precoce para possíveis mudanças de tendência.
2. Análise de Períodos de Tempo
Muitos traders Ichimoku analisam múltiplos períodos de tempo:
- Período de tempo maior para direção geral da tendência
- Período de tempo médio para sinais de entrada
- Período de tempo menor para timing preciso de entrada
3. Alargamento/Estreitamento do Senkou Span
- Nuvem Alargando: Aumento da volatilidade do mercado, tendência mais forte
- Nuvem Estreitando: Diminuição da volatilidade, potencial enfraquecimento da tendência
4. Kumo Plano (Nuvem Plana)
Quando ambos os Senkou Spans correm paralelos, frequentemente indica uma tendência forte com níveis claros de suporte/resistência.
Aplicações Práticas
Condições Ideais de Mercado
A Nuvem Ichimoku funciona melhor em mercados com tendência e em todos os períodos de tempo. Pode ser aplicada a:
- Forex
- Ações
- Commodities
- Criptomoedas
- Índices
Gestão de Risco
- Use a nuvem como um nível dinâmico de stop-loss
- Ajuste o tamanho da posição com base na espessura da nuvem (nuvem mais espessa = maior volatilidade)
- Considere o Kijun-sen como um stop móvel em tendências fortes
Compatibilidade de Períodos
As configurações tradicionais (9, 26, 52) foram baseadas na semana de negociação japonesa (que tinha 6 dias), então alguns traders ajustam essas configurações:
- 10, 30, 60 para gráficos diários
- 20, 60, 120 para sinais mais conservadores
- 7, 22, 44 para mercados ocidentais (semana de negociação de 5 dias)
Conclusão
A Nuvem Ichimoku oferece um sistema de negociação abrangente que fornece múltiplas camadas de informação do mercado em uma única visão. O que o torna poderoso não são apenas os sinais individuais, mas a confluência de múltiplos indicadores trabalhando juntos. Quando todos os componentes se alinham, o sistema Ichimoku pode fornecer oportunidades de negociação de alta probabilidade com parâmetros de risco claramente definidos.
Embora inicialmente pareça complexo, com prática, os traders podem realmente avaliar as condições do mercado "num relance", como Hosoda pretendia. Os componentes com deslocamento temporal do sistema também fornecem uma perspectiva única sobre a dinâmica do mercado, permitindo que os traders vejam potenciais níveis futuros de suporte e resistência antes que se tornem relevantes.
Resumo
1. Tenkan-sen (Conversion Line): short-term momentum indicator and dynamic support/resistance.
2. Kijun-sen (Base Line): medium-term momentum indicator and stronger support/resistance, also used as a trailing stop.
3. Senkou Span A (Leading Span A): forms the leading edge of the cloud (Kumo), projected 26 periods ahead.
4. Senkou Span B (Leading Span B): forms the trailing edge of the cloud, projected 26 periods ahead.
5. Chikou Span (Lagging Span): current closing price plotted 26 periods back, confirming trends and potential reversals.
The cloud (Kumo), formed between Senkou Span A and B, represents support and resistance zones, with thickness indicating volatility and strength. The indicator provides trend determination, entry and exit signals, and support/resistance levels. It is applicable across various markets including Forex, stocks, commodities, cryptocurrencies, and indices, and works best in trending markets and multiple time frames. Risk management features include dynamic stop-loss levels based on the cloud and position sizing adjustments according to cloud thickness. Traditional settings are (9, 26, 52) periods, with common adjustments for different trading weeks.


![Logótipo de "[Hamster-Coder] Pivot Points (Demo)"](https://cdn.ctrader.com/image/webp/87b54299-8c73-4942-9207-4bc6db824811_31153)


