
Hammer Pattern Indicator
지표
282 다운로드
버전 1.0, Mar 2025
Windows, Mac
5.0
리뷰: 1
설명
해머 패턴 지표 – 전략 설명
이 해머 패턴 지표는 캔들스틱 기반 반전 신호로 하락 추세에서 강세 해머 패턴을 식별합니다. 잠재적인 추세 반전을 감지하고 매수 기회를 강조하도록 설계되었습니다.
작동 원리
1️⃣ 하락 추세 감지
- 캔들의 종가가 3봉 전 종가보다 낮아야 하락 추세 가능성을 나타냅니다.
2️⃣ 해머 캔들스틱 구조 검증
- 작은 몸통: 캔들의 몸통이 상대적으로 작음 (전체 범위의 30% 이하).
- 긴 하단 그림자: 하단 꼬리가 몸통 크기의 최소 2배 이상 (하락 가격에 대한 강한 거부를 나타냄).
- 짧은 상단 그림자: 상단 꼬리가 몸통 크기의 30% 이하 (상단 저항이 적음을 나타냄).
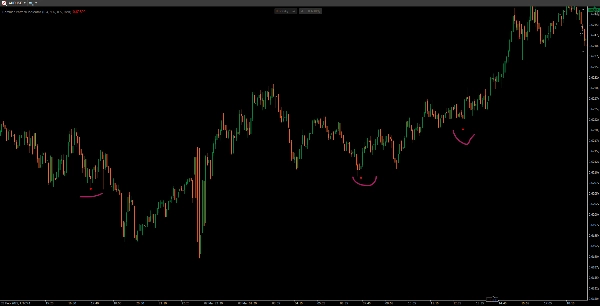
3️⃣ 매수 신호 표시
- 모든 조건이 충족되면 빨간 점(또는 선택한 색상)이 해머 캔들의 저점 바로 아래에 나타나 잠재적 반전의 시각적 확인 역할을 합니다.
주요 특징
✅ 이전 하락 추세를 확인하여 약한 신호를 필터링합니다.
✅ 몸통 크기, 그림자 길이, 색상에 대한 사용자 지정 매개변수를 제공합니다.
✅ 간단하지만 효과적인 캔들스틱 패턴으로 스윙 트레이더와 가격 행동 트레이더에게 적합합니다.
📌 최고 활용법: 추가 지표(예: 거래량, 지지선)와 함께 해머 패턴을 확인하여 더 강력한 신호를 얻으세요! 🚀
요약
지표 프로필
고객 리뷰
5.0
리뷰: 1
5 | 100 % | |
4 | 0 % | |
3 | 0 % | |
2 | 0 % | |
1 | 0 % |
고객 리뷰
August 18, 2025
Automatically detects hammer candlesticks, customizable, lightweight. Cons: No trend filter, no reliability scoring, possible false signals on low TFs.
상담
자주 묻는 질문(FAQ)
Signal
트레이딩 봇, 지표, 플러그인 등 cTrader Store에서 제공되는 상품은 제3자 개발자에 의해 제공되며, 이는 단순히 정보 및 기술적 접근을 목적으로 제공된 것입니다. cTrader Store는 중개인이 아니며, 투자 조언, 개인별 추천 또는 향후 성과에 대한 어떠한 보장도 제공하지 않습니다.


가격
가입일 21/02/2025
466.3M
거래량
180.83K
핍 수익
22
판매
6.92K
무료 설치