NNFX TP AND SL V1.1
Indikator
Version 1.0, Apr 2025
Windows, Mac
5.0
Bewertungen: 1

Beschreibung
🔹 Was es macht
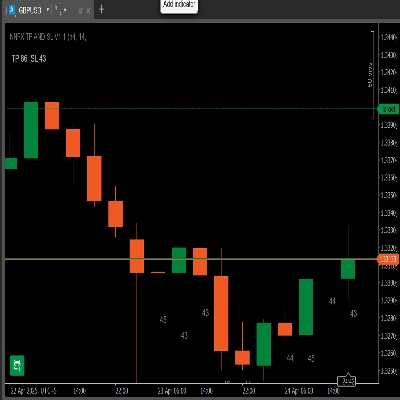
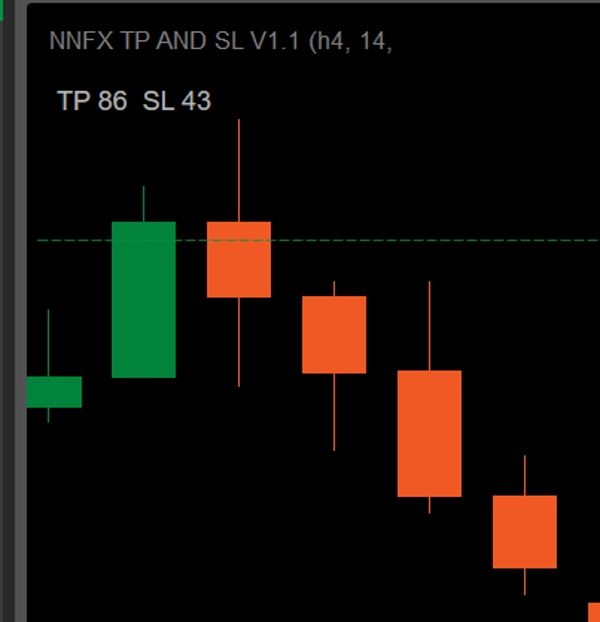
- Dynamisches Panel: Zeigt „TP × SL“ in Pips basierend auf deinem gewählten ATR-Zeitraum und TP-Multiplikator an.
- Letzte 10-Bar ATR-Beschriftungen: Druckt den ATR in Pips unter jedem der letzten 10 Kerzen (im gleichen Zeitrahmen).
- Zeitrahmen-Überprüfung: Wenn du es an einem anderen Chart-Zeitrahmen anbringst, warnt es „Zeitrahmen stimmen nicht überein – ATR wird auf den Bars nicht angezeigt.“
🔹 Hauptmerkmale
- Panel-Anzeige
-
- TP = ATR × dein Multiplikator (wähle 1 ÷ 4,5 in 0,5-Schritten)
- SL = ATR in Pips
- Beispiel: ATR = 43 → SL = 43 Pips. Wenn Multiplikator = 2 → TP = 86 Pips.
- Per-Bar ATR-Beschriftungen
-
- Unterlegt die letzten 10 Bars mit ihren ATR-Werten in Pips.
- Hält dich sofort über die jüngste Volatilität informiert.
- Zeitrahmen-Validierung
-
- Zeichnet Beschriftungen nur, wenn der Chart-Zeitrahmen mit deiner ATR-Zeitrahmen-Einstellung übereinstimmt.
- Andernfalls erscheint unten eine rote Warnung.
- Spike-Filterung (Optional)
-
- Aktiviere einen Mittelwert + k·σ-Filter, um Flash-Crash-Bars zu begrenzen.
- Konfigurierbarer σ-Multiplikator.
🔹 Wie man es installiert & benutzt
- Herunterladen
NNFXATRInfoIndicator_v1.1.algo. - In cTrader → Algo → Indikatoren, klicke Indikator importieren und wähle die
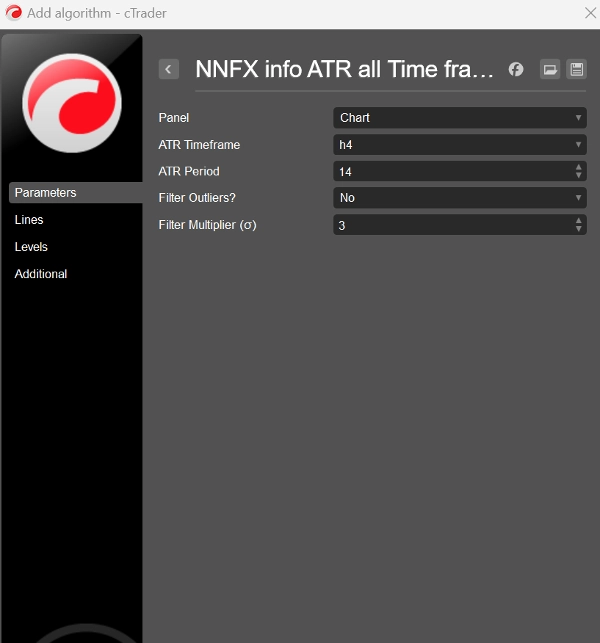
.algoDatei aus. - Zum Chart hinzufügen und öffne den Parameter-Tab:
-
- ATR-Zeitrahmen: z.B. H4
- ATR-Periode: Standard 14
- TP-Multiplikator: 1 – 4,5
- Spike-Filter verwenden?: Ja/Nein
- Filter-Multiplikator σ: Standard 3
- Klicke Zum Chart hinzufügen. Du wirst das „TP × SL“-Panel oben links und die letzten 10-Bar ATR-Beschriftungen automatisch sehen (wenn die Zeitrahmen übereinstimmen).
🔹 Warum du es lieben wirst
- Keine Mathematik: Keine Dezimal-zu-Pip-Umrechnungen mehr – alles in ganzen Pips.
- NNFX-bereit: SL & TP genau nach den ATR-Regeln deines Systems bemessen. Du musst nur den Zeitrahmen und die Handelsrichtung wählen, die du handeln möchtest – dann einfach den TP-Multiplikator an dein bevorzugtes Risiko-Ertrags-Verhältnis anpassen.
- Klar & Übersichtlich: Alle Volatilitätsinformationen in einer kompakten Overlay – keine zusätzlichen Fenster.
- Ultra-flexibel: Jedes FX-Paar, jeder Zeitrahmen, vollständig anpassbar.
- Verstärke deine NNFX-Einstiege mit präzisen ATR-basierten Stops und Zielen!
Zusammenfassung
Indikatorprofil
Kundenbewertungen
5.0
Bewertungen: 1
5 | 100 % | |
4 | 0 % | |
3 | 0 % | |
2 | 0 % | |
1 | 0 % |
Kundenbewertungen
May 3, 2025
the first test should keep DD under 3 percent, and the trade idea gets a pause before execution.
Diskussion
Häufig gestellte Fragen (FAQ)
ATR
Über den cTrader Store verfügbare Produkte, einschließlich Handelsbots, Indikatoren und Plugins, werden von externen Entwicklern bereitgestellt und nur zu Informations- und technischen Zugriffszwecken verfügbar gemacht. cTrader Store ist kein Broker und erbringt keine Anlageberatung, persönlichen Empfehlungen oder eine Garantie für zukünftige Performance.


Preis
Seit 24/04/2025
27.69M
Gehandeltes Volumen
629.04K
Pip-Gewinn