
Quantitative Qualitative Estimation
지표
203 다운로드
버전 1.0, Dec 2024
Windows, Mac
5.0
리뷰: 1
설명
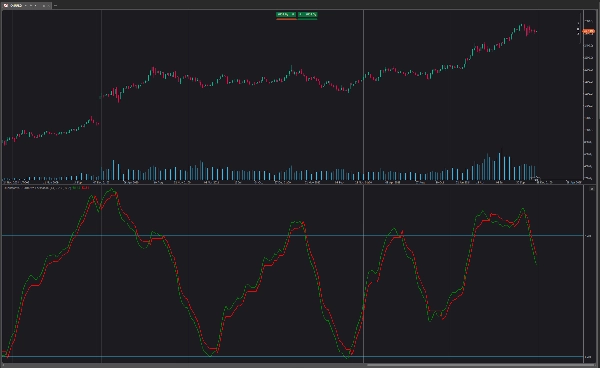
QQE(정량적 정성 평가) 가중 오실레이터는 후행 스톱이 제공하는 신호를 기반으로 RSI에 가중치를 부여하여 후행 스톱과의 교차가 발생하기 위해 더 많은 노력이 필요하도록 하여 원래 버전보다 개선되었습니다. QQE 가중 오실레이터는 부드럽게 처리된 RSI 오실레이터와 이 동일한 RSI에서 파생된 후행 스톱으로 구성됩니다.
이 오실레이터는 시장이 과매수/과매도 상태인지 나타내는 데 사용할 수 있으며, RSI의 선행 특성 덕분에 추세 반전의 초기 신호로도 활용할 수 있습니다.
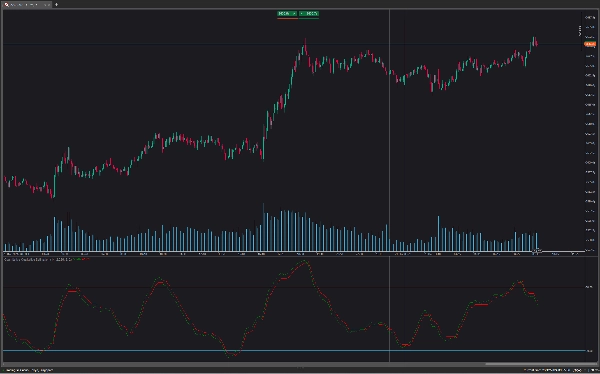
더 높은 Factor 값을 사용하면 장기 후행 스톱이 반환됩니다.
일반 RSI와 마찬가지로 발산은 반전을 나타낼 수 있습니다.
추가 가중치는 후행 스톱이 RSI를 교차하기 위해 필요한 "노력"의 정도를 제어합니다. 예를 들어, 후행 스톱 위의 RSI는 더 높은 가중치를 사용할 때 잠재적 교차가 발생하려면 더 큰 정도의 부정적 가격 변동이 필요합니다.
이로 인해 더 높은 가중치는 더 주기적이고 부드러운 결과를 반환할 수 있습니다.
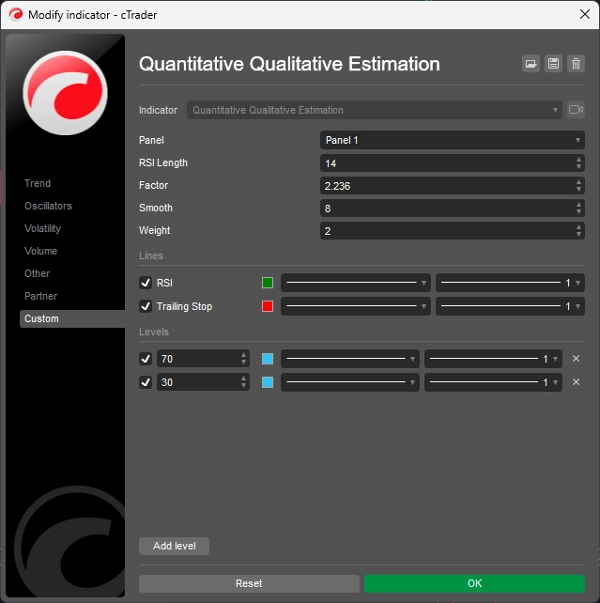
설정 변경 방법:
- Length: RSI 오실레이터의 길이.
- Factor: 후행 스톱 계산에 사용되는 곱셈 인자.
- Smooth: RSI 오실레이터의 부드러움 정도.
- Weight: RSI 계산에 사용되는 가중치 정도.
요약
지표 프로필
고객 리뷰
5.0
리뷰: 1
5 | 100 % | |
4 | 0 % | |
3 | 0 % | |
2 | 0 % | |
1 | 0 % |
고객 리뷰
August 18, 2025
Smooth RSI-based signals, detects trend and reversals, customizable settings. Cons: No alerts, no MTF mode, no built-in strategy templates.
상담
자주 묻는 질문(FAQ)
RSI
트레이딩 봇, 지표, 플러그인 등 cTrader Store에서 제공되는 상품은 제3자 개발자에 의해 제공되며, 이는 단순히 정보 및 기술적 접근을 목적으로 제공된 것입니다. cTrader Store는 중개인이 아니며, 투자 조언, 개인별 추천 또는 향후 성과에 대한 어떠한 보장도 제공하지 않습니다.


가격
2
판매
6.89K
무료 설치