Beschreibung
Darvas-Box-Theorie
Die Darvas-Box-Theorie ist eine von Nicolas Darvas in den 1950er Jahren entwickelte Handelstechnik. Es handelt sich um eine momentum-basierte Handelsstrategie, die die Kursbewegung nutzt, um potenzielle Ein- und Ausstiegspunkte am Markt zu identifizieren.
Wie die Darvas-Box funktioniert
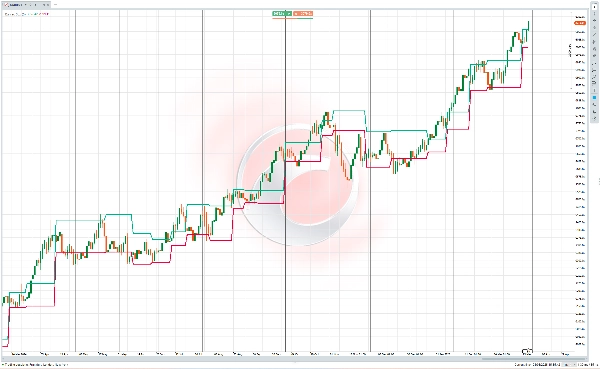
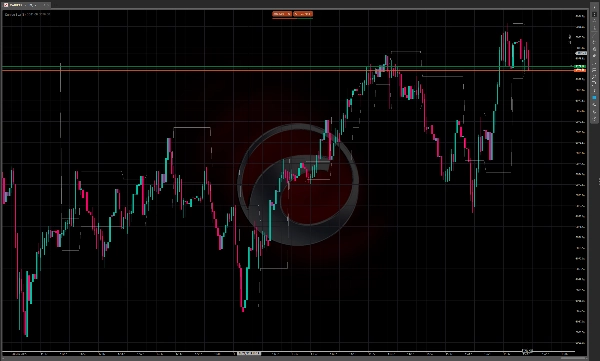
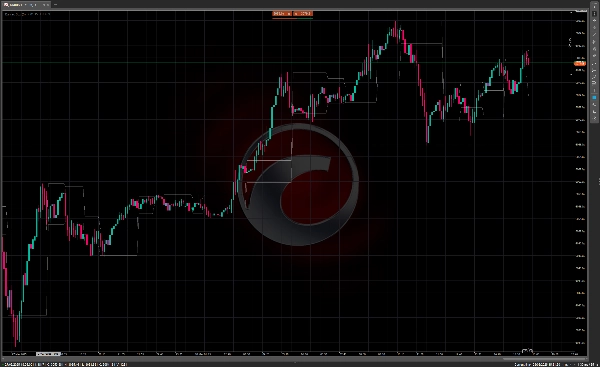
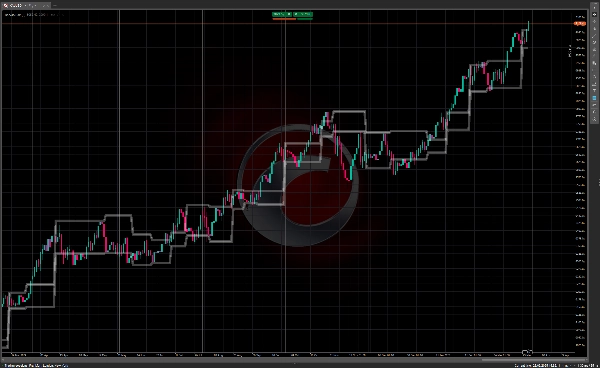
Die Darvas-Box-Methode beinhaltet das Identifizieren von „Boxen“ oder Handelsbereichen, in denen sich der Kurs einer Aktie konsolidiert, bevor er ausbricht. Die Hauptbestandteile sind:
- Der Kurs bildet einen definierten Handelsbereich (die „Box“) mit klaren oberen und unteren Grenzen
- Die obere Grenze stellt den Widerstand dar, während die untere Grenze als Unterstützung fungiert
- Ein Ausbruch über die Box signalisiert eine potenzielle Kaufgelegenheit
- Ein Durchbruch unter die Box kann als Verkaufssignal genutzt werden
Trader, die diese Technik verwenden, achten typischerweise auf Aktien mit steigendem Volumen zusammen mit der Kursbewegung, da dies auf ein stärkeres Momentum hinter dem Ausbruch hindeutet.
Geschichte der Darvas-Box-Theorie
Nicolas Darvas (1920–1977) war eine eher ungewöhnliche Persönlichkeit in der Handelshistorie. Geboren in Ungarn, war er kein professioneller Trader, sondern Tänzer, der in einem Tanzduo namens „Darvas und Julia“ mit seiner Halbschwester auftrat.
Während er in den 1950er Jahren mit seiner Tanzgruppe weltweit auf Tournee war, begann Darvas mit dem Aktienhandel zu experimentieren. Seine Umstände waren einzigartig – er traf oft Investitionsentscheidungen nur basierend auf Aktienkursen in Zeitungen, die ihm in verschiedenen Städten während seiner Tournee zugestellt wurden.
Darvas entwickelte seine Box-Theorie durch Versuch und Irrtum. Anfangs verlor er Geld an den Märkten, verfeinerte jedoch allmählich seinen Ansatz. Zwischen 1956 und 1958 verwandelte er Berichten zufolge eine Investition von 10.000 $ mit seiner Box-Methode in über 2 Millionen $ – eine außergewöhnliche Leistung, die Aufmerksamkeit erregte.
1960 veröffentlichte Darvas seine Methoden in dem Buch „How I Made $2,000,000 in the Stock Market“, das zu einem Klassiker der Handelsliteratur wurde. Das Buch schilderte seinen Weg und erklärte seine Box-Theorie, wodurch dieser Ansatz breite Aufmerksamkeit erhielt.
Was Darvas’ Methode besonders bemerkenswert machte, war ihre Einfachheit und dass sie von einem Außenseiter der Finanzbranche entwickelt wurde. Er konzentrierte sich hauptsächlich auf Kursbewegungen und Volumen statt auf Fundamentalanalyse, ein damals noch relativ neuer Ansatz, der viele technische Handelssysteme beeinflusst hat.
Die Darvas-Box-Technik ist heute bei technischen Tradern weiterhin beliebt, insbesondere bei denen, die momentum-basierte Strategien in Trendmärkten verfolgen.