

Beschreibung
Dieses Tool ermöglicht es Benutzern, einen Analysezeitraum festzulegen, z. B. täglich, und Hoch- und Tiefststände mit anpassbaren Farben, Stilen und Dicken in ihren Charts darzustellen. Es unterstützt mehrere vorherige Tage, was die Identifizierung bedeutender Preisaktionszonen erleichtert. Der Indikator verfügt außerdem über optionale Beschriftungen zur besseren Übersicht, die Händlern helfen, fundierte Entscheidungen auf Basis historischer Preisdaten zu treffen. Ideal für sowohl Anfänger als auch erfahrene Trader verbessert dieses Tool die Marktanalyse und Handelsstrategien.
Funktionen
Anpassbarer Zeitraum: Benutzer können einen bestimmten Zeitraum (z. B. täglich) auswählen, um vorherige Hoch- und Tiefstände zu analysieren, was eine maßgeschneiderte Visualisierung ermöglicht, die zu ihren Handelsstrategien passt.
Mehrere vorherige Tage: Die Möglichkeit, Hoch- und Tiefststände für mehrere vorherige Tage darzustellen, bietet einen umfassenden Überblick über bedeutende Preisaktionszonen.
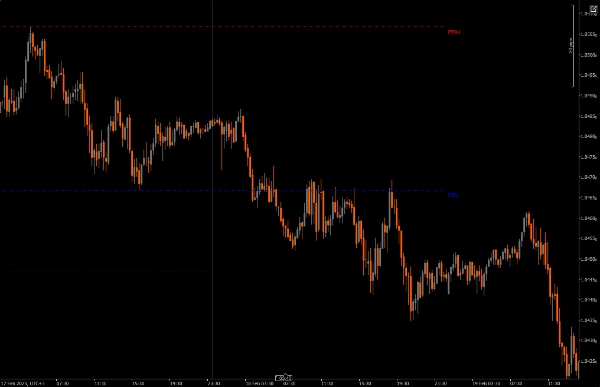
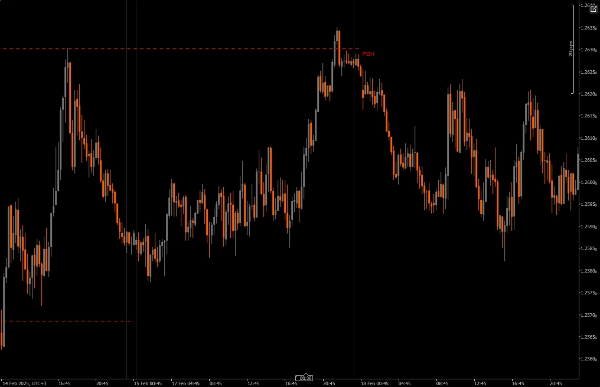
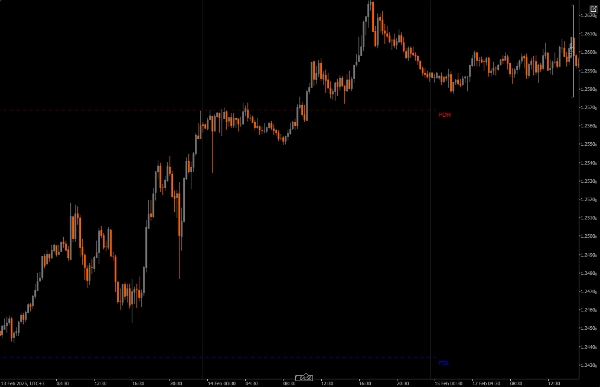
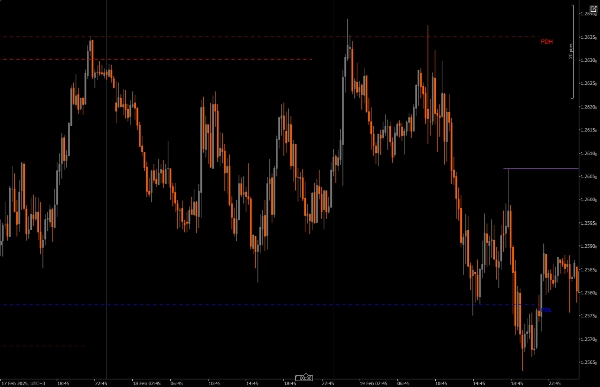
Dynamische Trendlinien: Der Indikator zeichnet Trendlinien für das Hoch und Tief des vorherigen Tages, was die schnelle Identifizierung potenzieller Umkehrzonen erleichtert.
Beschriftungsoptionen: Benutzer können Beschriftungen aktivieren, um die aktuellen Hoch- und Tiefwerte direkt im Chart anzuzeigen, was die Klarheit und das Verständnis verbessert.
Visuelle Anpassung: Trader können Linienfarben, -stile und -dicken nach ihren Vorlieben anpassen, um die Lesbarkeit des Charts zu verbessern.
Zeitraum-Einschränkungen: Der Indikator stellt sicher, dass er nur innerhalb festgelegter minimaler und maximaler Zeitraum-Einstellungen arbeitet, um die Chartübersicht zu reduzieren, während andere Zeiträume durchlaufen werden.
Zu beachten
PDH oder PDL im Markt können als Draw on Liquidity (DOL) verwendet oder zur Rahmung einer Umkehr genutzt werden.
Umkehrungen können anhand von PDH und PDL gerahmt werden, wenn es zu einem Ausbleiben der Verdrängung kommt.
Wenn der Preis ein PD-Array oberhalb oder unterhalb respektiert und es nicht schafft, über ein Tageshoch oder -tief hinaus zu verdrängen, kann die nächste Kerze antizipiert werden.
Ist es wahrscheinlicher, dass der Preis das Hoch oder Tief des vorherigen Tages erreicht? Bei Verwendung von PDH PDL als Draw on Liquidity (DOL)
Installation: Laden Sie die Daily Range Liquidity Zones (PDH PDL) herunter und installieren Sie sie auf Ihrer cAlgo-Plattform.
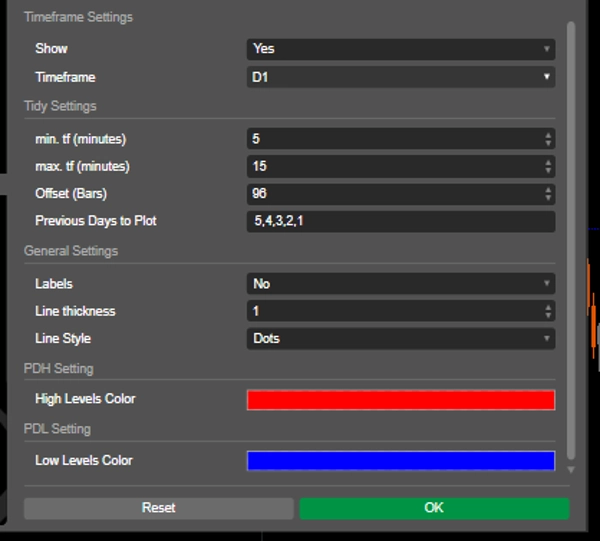
Einrichtung: Öffnen Sie die Indikatoreinstellungen und wählen Sie den gewünschten Analysezeitraum, die Anzahl der darzustellenden vorherigen Tage und passen Sie visuelle Parameter wie Linienfarbe und -dicke an.
Verwendung des Indikators: Der Indikator zeichnet automatisch die Hoch- und Tiefststände des vorherigen Tages basierend auf den angegebenen Einstellungen in Ihrem Chart ein.
Analyse: Beobachten Sie die dargestellten Niveaus während des Handels. Nutzen Sie diese Niveaus, um potenzielle Umkehrungen zu rahmen und fundierte Handelsentscheidungen zu treffen.
Empfohlene Begleit-Tools
cTrader: Die native Plattform für cAlgo, die eine nahtlose Umgebung für die Nutzung und Anpassung von Indikatoren bietet.
Technische Analysetools: Kombinieren Sie diesen Indikator mit anderen Tools wie Fair Value Gaps (FVG) und Reversal Pattern Indicators (CRT), um Ihre Handelsstrategie und Marktanalyse zu verbessern.
Risikomanagement-Tools: Nutzen Sie Positionsgrößenrechner und Stop-Loss-Tools, um das Risiko beim Handel rund um die identifizierten Hoch- und Tiefststände effektiv zu steuern.
Durch die Integration der Daily Range Liquidity Zones (PDH PDL) mit diesen Tools können Trader ihre Marktanalyse verbessern und ihre Erfolgschancen bei der Navigation durch die Komplexität der Preisaktion erhöhen.
Zusammenfassung
Kundenbewertungen
5 | 100 % | |
4 | 0 % | |
3 | 0 % | |
2 | 0 % | |
1 | 0 % |


