Opis
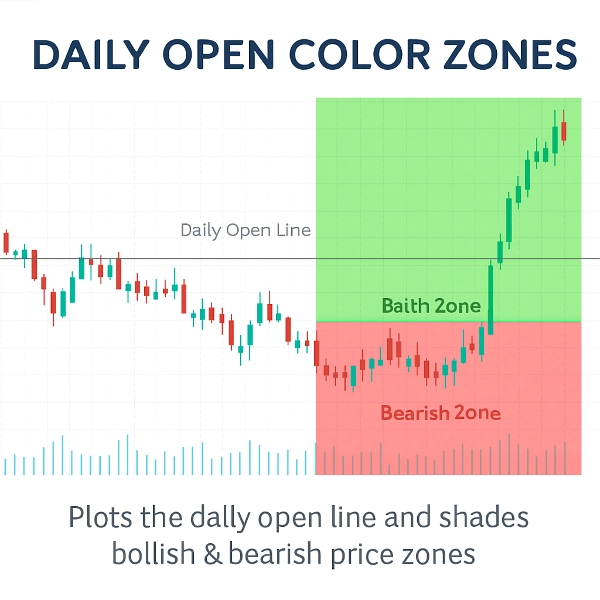
Ten wskaźnik to profesjonalne narzędzie zaprojektowane do rysowania Linii Otwarcia Dnia i natychmiastowego zacieniania byczych i niedźwiedzich stref cenowych wokół niej. Zamiast pozostawiać traderów w niepewności, dostarcza wyraźną wizualną mapę nastrojów rynkowych od samego początku dnia. Jego celem jest pomoc w natychmiastowym rozpoznaniu, czy rynek handluje powyżej czy poniżej otwarcia dnia — kluczowego punktu odniesienia dla strategii intraday.
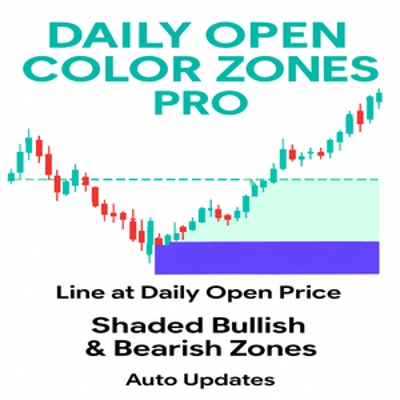
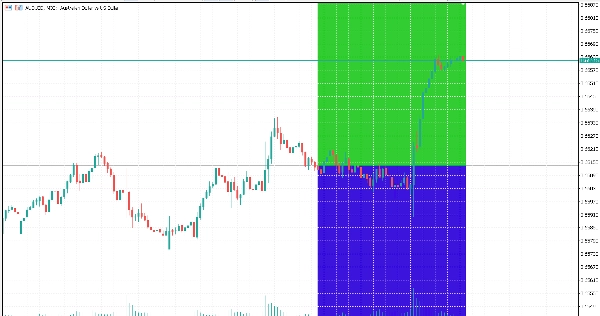
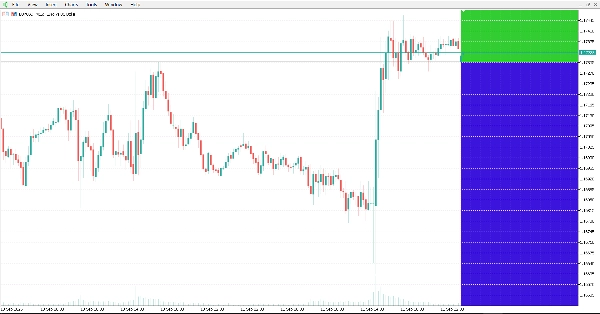
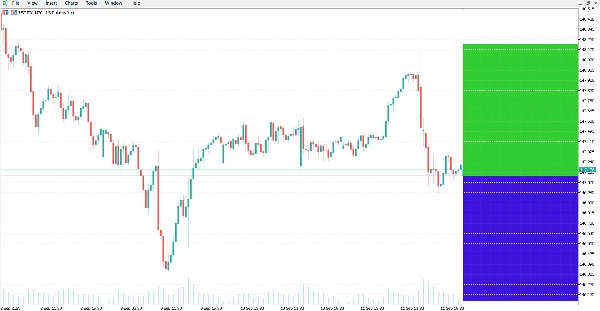
Wskaźnik automatycznie rysuje poziomą linię na cenie otwarcia dnia i zacienia wykres:
Zielona Strefa powyżej linii dla byczego terytorium.
Czerwona Strefa poniżej linii dla niedźwiedziego terytorium.
Ten prosty, a zarazem potężny wizualny sygnał pomaga traderom szybko ocenić nastawienie, dostrzec potencjalne odwrócenia i dopasować transakcje do dominującego kierunku rynku.
Funkcje
Automatyczna Linia Otwarcia Dnia: Rysuje dokładną cenę otwarcia dnia z precyzją.
Wyraźne Strefy Kolorów: Natychmiast rozróżnia bycze i niedźwiedzie obszary za pomocą konfigurowalnych kolorów i przezroczystości.
Dynamiczne Aktualizacje: Strefy automatycznie dostosowują się z każdą nową świecą i powiększeniem wykresu.
Konfigurowalny Wygląd: Zmień styl linii, grubość i kolory stref, aby dopasować je do motywu wykresu.
Lekki i Szybki: Optymalizowany pod kątem minimalnego zużycia CPU, nawet na kontach na żywo z dużymi zbiorami danych.
Działa na Wszystkich Symbolach i Interwałach: Od forexu po surowce, indeksy i kryptowaluty.
Dlaczego go używać? Otwarcie dnia to jeden z najbardziej obserwowanych poziomów cen przez profesjonalnych traderów. Poprzez wizualne oddzielenie byczych i niedźwiedzich stref, ten wskaźnik daje natychmiastowy odczyt nastrojów rynkowych, pomagając podejmować szybsze i pewniejsze decyzje handlowe.
Podsumowanie To nie jest tylko linia na twoim wykresie — to wizualna przewaga handlowa. Niezależnie czy skalpujesz, handlujesz dziennie, czy swingowo, wskaźnik Daily Open Color Zones utrzyma cię przy jednym z najważniejszych poziomów cen dnia.