Описание
Индикаторы Pinescriptlabs Store: 🤖Pinescriptlabs Store cBots :
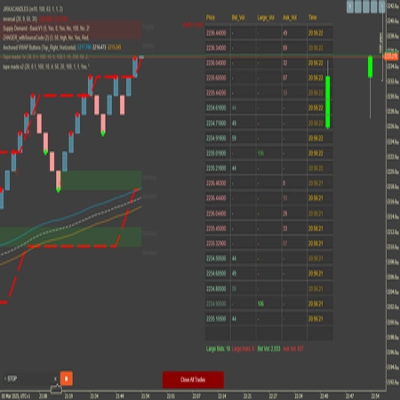
ICT Power of 3 (cBot) Gold & BTC BreakoutSession Pivots(new)YieldShield"
SmartTrend Support &
Resistance Lines
Dynamic Market Structure
Анализ поворотных точек
Fibonacci Linear
Регрессия на нескольких таймфреймах
Multi-Level Candle Bias
Tracker
Auto Support and
Resistance Trend Lines
All Support and
Resistance Levels
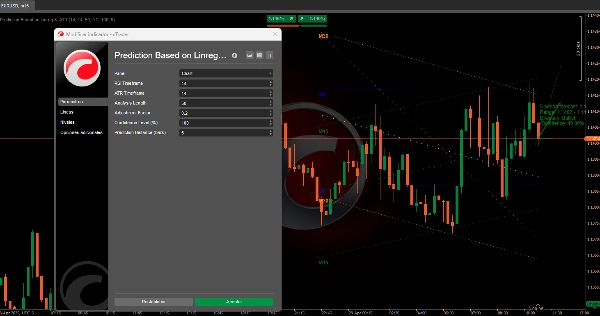
📈 Мульти-Таймфрейм Регрессионный Канал и Алгоритм Прогноза ATR
Эта система прогнозирует потенциальное движение цены актива, комбинируя анализ трендов на нескольких таймфреймах 📊, волатильность рынка 📉 и подтверждение техническими индикаторами ✅. Цель — спрогнозировать будущий ценовой диапазон с измеримой уверенностью, что идеально подходит для выявления высоковероятных возможностей с соотношением риск-вознаграждение 💰.
🔧 Как это работает шаг за шагом
1️⃣ Анализ трендов на нескольких таймфреймах
- Регрессионные каналы на разных таймфреймах:
Алгоритм одновременно анализирует четыре разных таймфрейма (от краткосрочного до долгосрочного). Для каждого: -
- Вычисляет статистическую линию тренда на основе исторического поведения цены.
- Определяет прогнозный канал вокруг этой линии (используя прошлую волатильность для установки верхних/нижних границ).
- Иерархическое влияние:
Краткосрочные таймфреймы имеют больший вес в итоговом направлении, отражая их чувствительность к недавним движениям.
2️⃣ Интеграция волатильности (ATR) 🌊
- Динамическая корректировка волатильности:
Прогнозы адаптируются к текущим рыночным условиям: -
- Высокая волатильность → Широкие прогнозы
- Низкая волатильность → Консервативные корректировки
- Масштабирование будущего диапазона:
Прогнозная полоса автоматически регулируется в зависимости от ожидаемой волатильности.
3️⃣ Система подтверждения тренда ✅
Комбинирует четыре ключевых сигнала для проверки или оспаривания направления, основанного на регрессии:
- Пересечения скользящих средних (подтверждение тренда)
- Осцилляторы момента (оценка силы)
- Индикаторы волатильности (обнаружение перекупленности/перепроданности)
- Анализ дивергенций (подсказки о развороте тренда)
- Результат: Система оценки, которая усиливает или ставит под сомнение прогнозируемый тренд.
4️⃣ Расчет уверенности 🎯
- Согласование таймфреймов:
Уверенность увеличивается, когда тренды согласуются на разных таймфреймах. - Порог, заданный пользователем:
Трейдеры могут установить минимальный уровень уверенности для фильтрации только сигналов с высокой степенью достоверности.
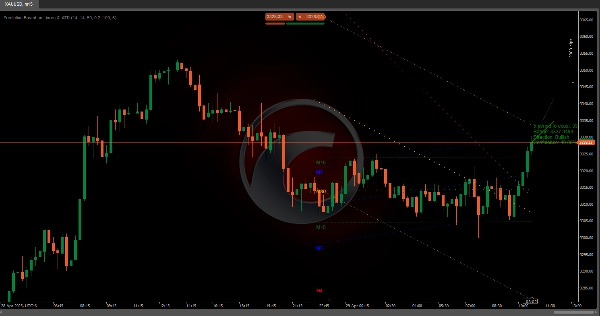
5️⃣ Интуитивная визуализация 📉📈
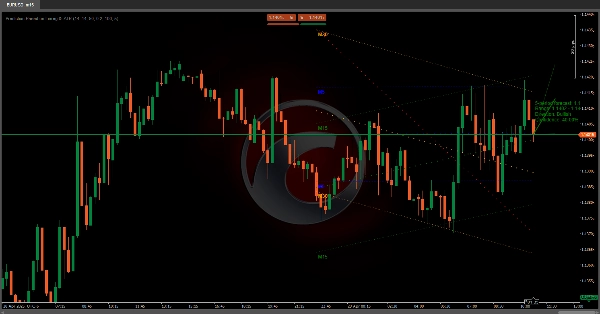
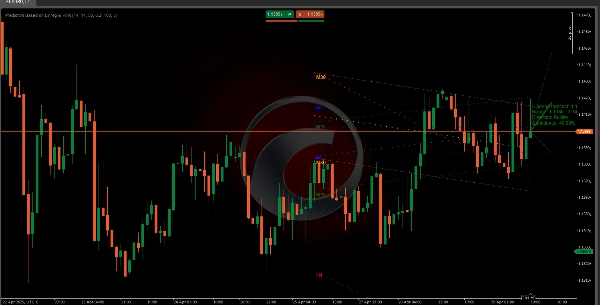
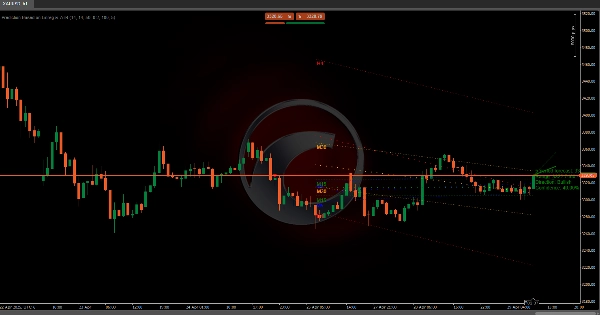
- Линия прогноза:
Показывает центральный ожидаемый путь (зеленый = бычий 🟢, красный = медвежий 🔴, серый = нейтральный ⚪). - Диапазонные полосы:
Выделяют зону наиболее вероятного движения цены, скорректированную с учетом волатильности. - Информационная метка:
Резюмирует прогнозируемую цену, диапазон, направление и уровень уверенности.
🌟 Ключевые преимущества
- Многомерный подход: Комбинирует тренд, волатильность и моментум для снижения ложных сигналов.
- Самонастраивающийся: Автоматически адаптируется к флуктуирующим или трендовым рынкам.
- Прозрачные метрики: Количественная уверенность помогает управлять ожиданиями.
📌 Практический пример
Если система обнаруживает:
- Бычий тренд на коротких таймфреймах + подтверждение момента
- Низкую недавнюю волатильность
- Сильное согласование таймфреймов
→ Прогнозирует рост цены с узкой полосой и высокой уверенностью (например, 85%) 🚀
Сводка
The ATR component dynamically adjusts the prediction bands to current market conditions, widening during high volatility and narrowing during low volatility periods. A trend confirmation system integrates four key signals—moving average crosses, momentum oscillators, volatility indicators, and divergence analysis—to validate or question the regression-based trend, producing a scoring system that indicates trend strength.
Confidence levels are calculated based on alignment of trends across timeframes, with user-configurable thresholds to filter signals by certainty. Visualization includes a central prediction line (color-coded for bullish, bearish, or neutral trends), range bands highlighting probable price zones, and an info label summarizing projected price, range, direction, and confidence.
The indicator supports markets including cryptocurrencies (e.g., BTCUSD), commodities (e.g., XAUUSD), and others. It aims to identify high-probability risk-reward opportunities by combining trend, volatility, and momentum analysis in a self-adjusting, transparent framework.