present
Зарегистрируйтесь и получите скидку $50 на первую покупку
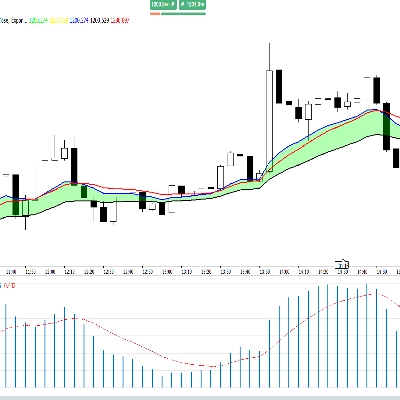
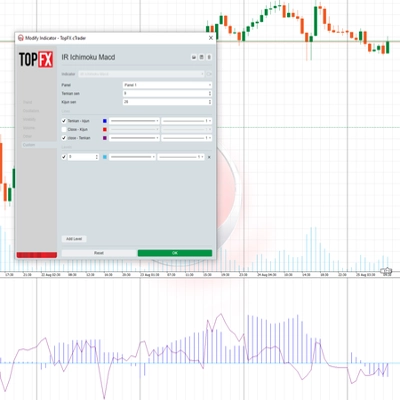
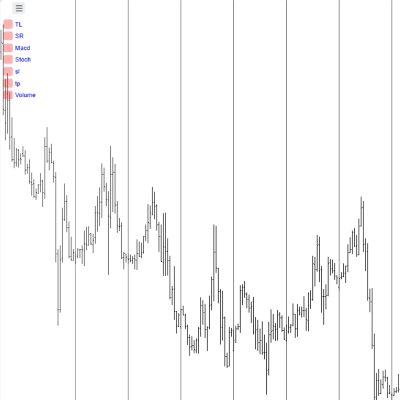
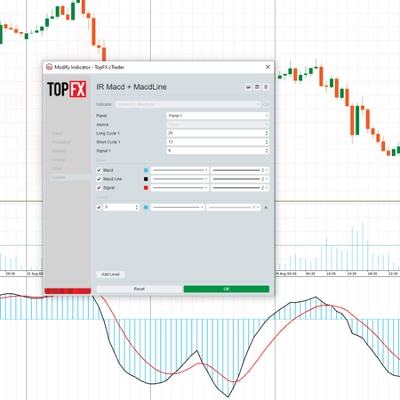
Trading product for IR Macd + MacdLine Индикатор MACD, image 1
IR Macd + MacdLine
5.0
Отзывы: 2
5.66K
Бесплатные установки

Описание

некоторые пользователи добавляют скользящую среднюю к macd, чтобы лучше видеть.

в ctrader 4.3.11 с этим есть проблема.

я сделал macd, который имеет macdline для этих пользователей

Сводка

ИИ-сводка
IR Macd + MacdLine is a technical indicator designed for use on the cTrader platform. It enhances the traditional MACD (Moving Average Convergence Divergence) by incorporating a MACD line, addressing issues found in cTrader version 4.3.11 related to adding moving averages to the MACD. This indicator aims to provide clearer visualization of MACD signals by combining the MACD histogram with an additional MACD line, facilitating better momentum analysis. It is categorized under momentum indicators and supports analysis based on MACD histogram and moving average convergence divergence concepts.
Профиль индикатора

Обсуждение

Отзывы покупателей

5.0
Отзывы: 2
5
100 %
4
0 %
3
0 %
2
0 %
1
0 %
Отзывы покупателей
August 12, 2025
Pros: Clear MACD visualization with extra signal line, customizable, stable. Cons: No alerts, no MTF mode, no auto-signal marking.
April 17, 2025
MACD指标写的比较有特色

Частые вопросы

MACD
Продукты, доступные в cTrader Store, включая торговых ботов, индикаторы и плагины, предоставляются сторонними разработчиками и доступны исключительно в информационных и технических целях. cTrader Store не является брокером и не предоставляет инвестиционные консультации, персональные рекомендации или какие-либо гарантии будущей доходности.

Больше от этого автора
Логотип продукта "IR Candle MTF"
4.6
(6)
Бесплатно
with this indicator you could see other time frame candle in your chart.
show spread on chart
this indicator show macd on chart.
Multi Time Frame Moving Average is a powerful and flexible indicator for cTrader
 this moving include everything that a trader needs from Moving Average.
this indicaotr show distance between Tenkan to Kijun, Close to Kijun and Close to Tenkan 
Add Slowing to IR Moving Average.
IR Candle Open plots customizable opening price lines for daily, weekly, and monthly candles
Coral indicator
you could put your check list in your chart you could split your test with “,” you could put your checklist in indicat
this indicator show other time frame close in lower time frame. for ex: show daily close in m 15.
don't move to the end of chart after timeframe changing. it should be better to use for near history. for long history

Вам также может понравиться

Market structure signals graded A to C, each with a drawn trade plan, plus an adaptive trend ribbon and a trend matrix
Protect your funded account. Real-time Daily Equity Drawdown monitor with Green / Orange / Red flashing alerts.
ORDER BOOK TRACKS SMART MONEY IN REAL TIME!
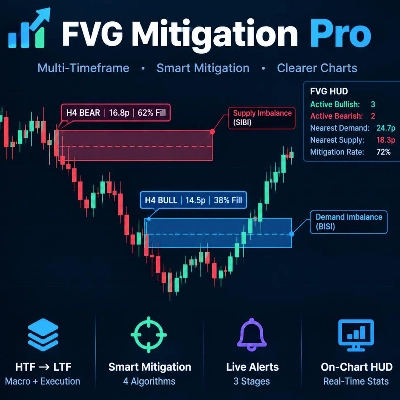
Fair Value Gap scanner with live fill telemetry, 50% CE lines, 4 mitigation rules, and a 3-stage native alert system.
An Indicator made for scalping. Shows you the Sniper movement on Chart with the colour signals.
Angora Pattern Recognition is a cTrader indicator that finds, draws and tracks classic chart patterns automatically.
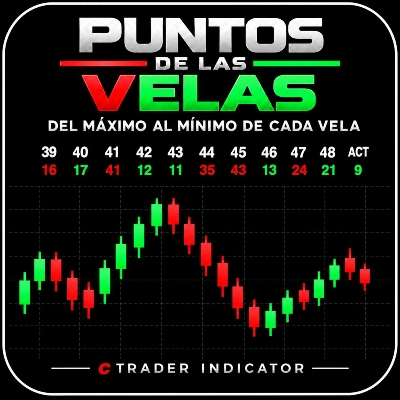
Mide en puntos la distancia entre el Máximo y el Mínimo alcanzados por cada vela, incluida la vela actual.
ICT Order Block Advanced
Логотип продукта "[Stellar Strategies] VBO"
4.8
(5)
$19
/
$29
Next-gen Volume Oscillator using Hyperbolic Tangent math. No repainting. Includes arrows, alerts, and overlay mode 🎯
Stop drawing levels manually. SmartLevels Pro detects, scores & predicts — H4/H1/M15 · cTrader
Логотип продукта "Momentum Fair Value Gap"
4.5
(4)
$19
/
$20
It identifies areas of market imbalance (Fair Value Gaps or FVGs) and projects them on the chart in a smart way
This indicator is a valuable tool for traders looking to identify significant opening price level of any asset.
Market Cipher B
Custom VWAP Indicator for cTrader
Traders Dynamic Index (TDI) — Divergence Edition
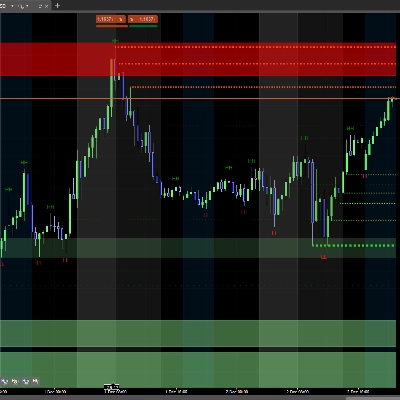
Supply and demand zones. They're important. Here's a free version to get you started!
Логотип продукта "Equity and Balance"
4.4
(5)
$19
/
$35
Displays real-time balance, equity, P&L, margin metrics directly on your charts.
US Dollar Index

Цена

5.66K
Бесплатные установки