present
Зарегистрируйтесь и получите скидку $50 на первую покупку
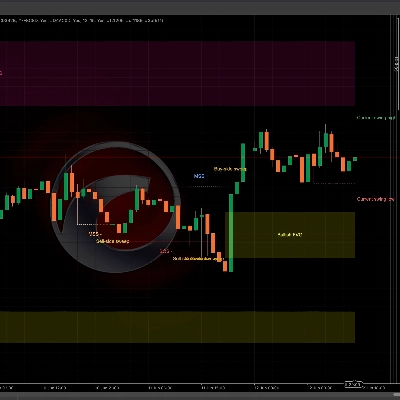
Trading product for IR CheckList Индикатор, image 1
IR CheckList
5.64K
Бесплатные установки

Описание

вы можете поместить свой контрольный список в свою диаграмму

вы можете разделить свой тест с помощью «,»

вы можете поместить свой контрольный список в область индикатора

Сводка

ИИ-сводка
IR CheckList is a trading indicator that allows users to integrate a customizable checklist directly within their chart interface. It supports inputting multiple checklist items separated by commas, enabling users to organize and display their test criteria or trading steps clearly in the indicator area of the chart. This tool is designed to help traders visually track and manage their checklist tasks alongside market data without switching contexts.
Профиль индикатора

Обсуждение

Отзывы покупателей

0.0
Отзывы: 0
Отзывы покупателей
У этого продукта еще нет отзывов. Уже попробовали его? Поделитесь впечатлениями!

Частые вопросы

Продукты, доступные в cTrader Store, включая торговых ботов, индикаторы и плагины, предоставляются сторонними разработчиками и доступны исключительно в информационных и технических целях. cTrader Store не является брокером и не предоставляет инвестиционные консультации, персональные рекомендации или какие-либо гарантии будущей доходности.

Больше от этого автора

Логотип продукта "IR Candle MTF"
4.6
(6)
Бесплатно
with this indicator you could see other time frame candle in your chart.
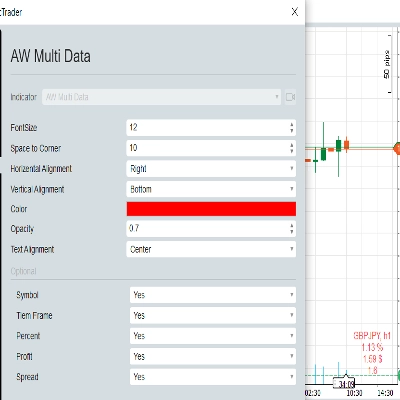
show spread on chart
some user add moving average to macd to see better. in ctrader 4.3.11 there is a problem with this . I make a macd tha
this indicator show macd on chart.
Multi Time Frame Moving Average is a powerful and flexible indicator for cTrader
 this moving include everything that a trader needs from Moving Average.
this indicaotr show distance between Tenkan to Kijun, Close to Kijun and Close to Tenkan 
Add Slowing to IR Moving Average.
IR Candle Open plots customizable opening price lines for daily, weekly, and monthly candles
Coral indicator
this indicator show other time frame close in lower time frame. for ex: show daily close in m 15.
don't move to the end of chart after timeframe changing. it should be better to use for near history. for long history

Вам также может понравиться

Smart Money Concepts (SMC) indicator with real-time Fair Value Gap (FVG) boxes, $50 round numbers, and live market HUD.
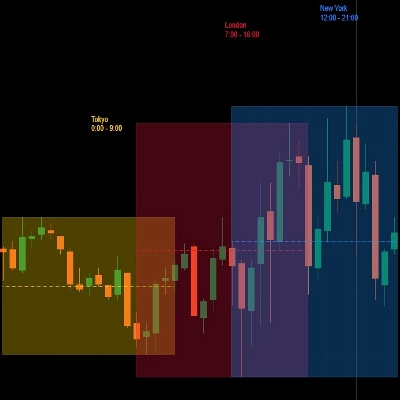
Market Sessions
Multi-symbol Inside Bar Scanner with dashboard & breakout alerts
Trading.FC$_vwap Algo shows VWAP trends, dynamic support/resistance and deviation bands to spot potential trade entries.
Institutional FVG detection with HTF projection, precise volume deltas, and smart fill logic.
Protect your funded account. Real-time Daily Equity Drawdown monitor with Green / Orange / Red flashing alerts.
Ultimate Market Footprint: Price Action Zones (Gaps + Order Blocks + Signals)
The daily bias estimator indicator uses ICT concepts to show whether the chart is bullish or bearish on multi-time frame
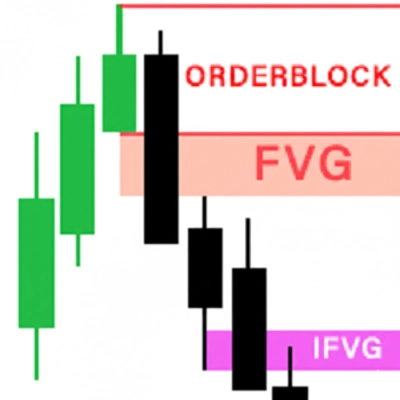
All-In-One solution for ICT's FVG IFVG ORDERBLOCK in advanced mode.
Trend indicator with multi-timeframe filters, generating signals only on fully completed bricks & candles. No Repaint.
Plots automatic psychological levels at round-number zones – major structure & liquidity levels.
Supertrend Indicator
Session volume profiles from tick volume: POC, value area high and low, and naked POCs extended until touched.
Marks NY session range, detects wick sweeps beyond box edges.. One signal per day. Overlay, no repainting!
📊 Liquidation Map: Potential areas where highly leveraged investors might face liquidations.
The Parabolic SAR, or "Stop and Reverse," is a dynamic technical analysis tool.
WinSMC is an overlay SMC indicator for cTrader. It helps you visually identify!
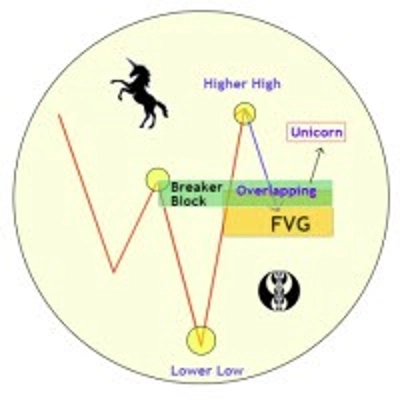
Unicorn Model ICT Indicator — Smart Trading with Precision

Цена

5.64K
Бесплатные установки