present
新規登録で初回購入時に$50オフ
Trading product for IR Coral インジケーター, image 1
IR Coral
5.0
レビュー: 1
5.64K
無料インストール

説明

サンゴ指標


概要

AIによる概要
IR Coral is a technical indicator designed for use in trading platforms. It provides analytical insights based on market data to assist traders in making informed decisions. The product functions as a standalone indicator without specified trading strategies, timeframes, or market symbols. It does not include built-in risk management parameters or position sizing guidelines. IR Coral is intended for integration within trading interfaces to enhance market analysis through its indicator outputs.
インジケーターのプロフィール

ディスカッション

カスタマーレビュー

5.0
レビュー: 1
5
100 %
4
0 %
3
0 %
2
0 %
1
0 %
カスタマーレビュー
August 2, 2025

よくあるご質問

cTrader Storeで入手可能な取引ボット、インジケーター、プラグインなどの商品は、第三者の開発者が提供するものであり、情報と技術の取得のみを目的としてご利用いただけます。cTrader Storeはブローカーではなく、投資助言や個人的な推奨を行うことも、将来のパフォーマンスを保証することもありません。


この作成者の他の商品

「IR Candle MTF」ロゴ
4.6
(6)
無料
with this indicator you could see other time frame candle in your chart.
show spread on chart
some user add moving average to macd to see better. in ctrader 4.3.11 there is a problem with this . I make a macd tha
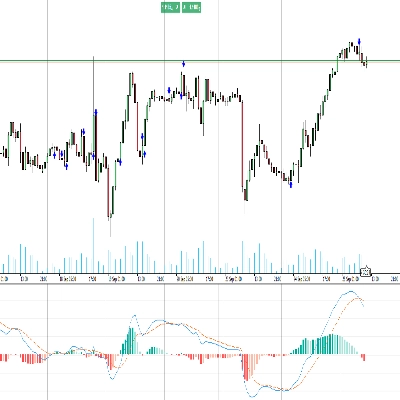
this indicator show macd on chart.
Multi Time Frame Moving Average is a powerful and flexible indicator for cTrader
 this moving include everything that a trader needs from Moving Average.
this indicaotr show distance between Tenkan to Kijun, Close to Kijun and Close to Tenkan 
Add Slowing to IR Moving Average.
IR Candle Open plots customizable opening price lines for daily, weekly, and monthly candles
you could put your check list in your chart you could split your test with “,” you could put your checklist in indicat
this indicator show other time frame close in lower time frame. for ex: show daily close in m 15.
don't move to the end of chart after timeframe changing. it should be better to use for near history. for long history

これも好きかも

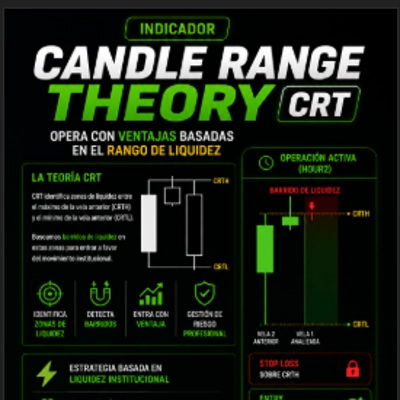
CRT Sweep Tracker is an advanced panel for Candle Range Theory (CRT) traders to track HTF sweeps and manage live trades.
Heatmap Pro analiza la volatilidad, el volumen y la acción del precio para "pintar" tu gráfico con zonas de color.
You can use the cTrader Pivot Points Pro indicator to find a good pullback entry in a trend
Brooks price action breakout mode patterns
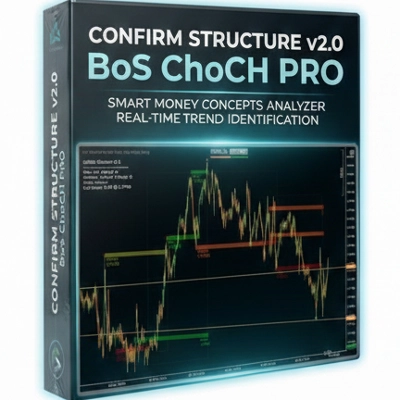
BoS ChoCH Pro,Strict Mode,False Breakout Filter,Average hit rate: 72-78%
「KANDIKA HEAT MAP」ロゴ
4.6
(5)
$19
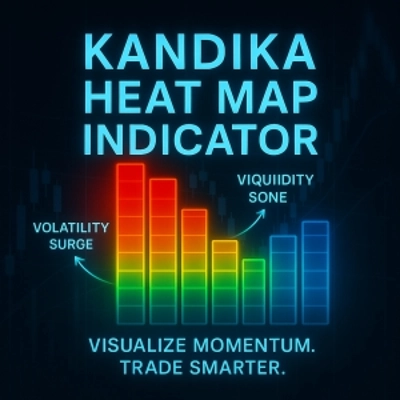
Color-Based Market Pressure & Volatility Visualizer The Kandika Heatmap Indicator
Trend-filtered signals, transparent trade plans and a multi-timeframe decision panel for cTrader.
MULTI-TIMEFRAME ROLLING STANDARD DEVIATION TRADING SIGNAL - Smart Volatility Breakout System
Easy Trade: Trend & Breakout Indicator for cTrader
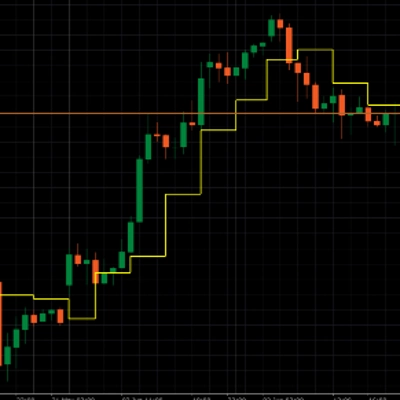
It draws a step line that visualize the movement of H4. Particularly effective when trade on lower timeframe.
View tick activity across a selected chart range with Point of Control, Value Area High and Value Area Low.
Customize the MACD! Choose colors, get real-time tick updates, and see crossover points for enhanced trading precision.
Precision SMC tool with HTF sweeps, MSS confirmation & smart FVG detection for high-probability reversals.
GOLD SENTINEL v1.0 - A CANDLE-COLORING INDICATOR FOR GOLD.
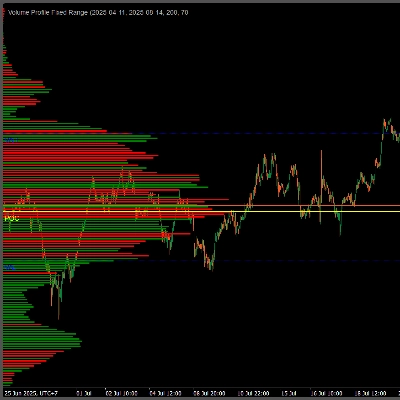
Professional Volume Profile Indicator - Shows volume distribution, POC, Value Areas & Buy/Sell pressure.
Trendlines That Adapt. Breakouts That Matter.
Session volume profiles from tick volume: POC, value area high and low, and naked POCs extended until touched.
Candle Timer best used for Scalper

価格

5.64K
無料インストール