
Описание
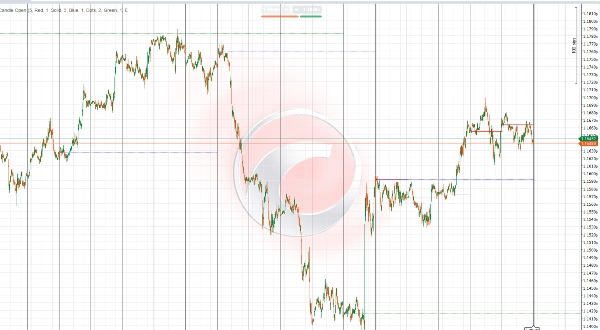
Индикатор открытия свечи IR — это универсальный и настраиваемый инструмент, который отображает цены открытия недельных, дневных и месячных свечей на вашем торговом графике. Трейдеры могут выбирать количество периодов (дней, недель, месяцев) для отображения, что позволяет гибко анализировать несколько таймфреймов в соответствии с их стратегией.
Основные функции включают:
- Точное отображение открытий свечей для пользовательских количеств дневных, недельных и месячных периодов.
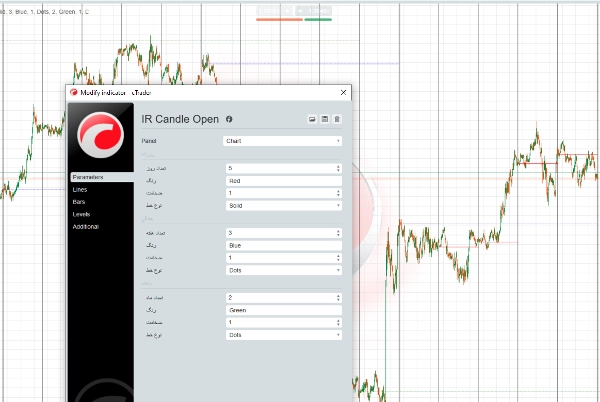
- Настраиваемые стили линий: пользователи могут выбирать тип линии (сплошная, пунктирная, точечная), цвет и толщину для лучшей читаемости графика.
- Поддержка визуализации нескольких таймфреймов для выявления важных ценовых уровней на разных временных горизонтах.
- Помогает выявлять потенциальные зоны поддержки и сопротивления на основе этих ключевых цен открытия.
- Совместим с различными рынками, такими как Форекс, сырьевые товары, индексы и криптовалюты.
Эта гибкость позволяет трейдерам адаптировать отображение индикатора под свои личные предпочтения и стиль торговли, улучшая ясность и повышая качество принятия решений на основе ключевых ценовых уровней.
توضیح فارسی (بهروز شده)
اندیکاتور IR Candle Open ابزاری منعطف و قابل تنظیم است که قیمتهای باز شدن کندلهای هفتگی، روزانه و ماهیانه را روی نمودار معاملاتی شما نمایش میدهد. کاربران میتوانند تعداد دورههای روزانه، هفتگی و ماهیانه که میخواهند خطوط آنها نمایش داده شود را انتخاب کنند تا تحلیل چندتایمفریمی متناسب با سبک معاملاتی خود داشته باشند.
ویژگیهای کلیدی:
- نمایش دقیق خطوط قیمت باز شدن کندلها برای تعداد دورههای دلخواه در تایمفریمهای روزانه، هفتگی و ماهیانه.
- امکان انتخاب نوع خط (ساده، خطچین، نقطهچین)، رنگ و ضخامت خطوط برای بهبود وضوح و خوانایی نمودار.
- پشتیبانی از تحلیل چندتایمفریمی جهت شناسایی سطوح مهم قیمتی در بازههای زمانی مختلف.
- کمک به تشخیص سطوح حمایت و مقاومت احتمالی بر اساس این نقاط کلیدی باز شدن قیمتها.
- مناسب برای استفاده در بازارهای مختلف مانند فارکس، کالاها، شاخصها و رمزارزها.
این قابلیتها به تریدرها امکان میدهد تا نمایش اندیکاتور را بر اساس سلیقه و سبک معاملاتی خود تنظیم کنند و با وضوح بیشتر، تصمیمات بهتری بگیرند.
Сводка
Отзывы покупателей
5 | 100 % | |
4 | 0 % | |
3 | 0 % | |
2 | 0 % | |
1 | 0 % |


