
IR Macd on Chart
Индикатор
416 скачивания
Версия 1.0, Jan 2025
Windows, Mac
5.0
Отзывы: 1
Описание
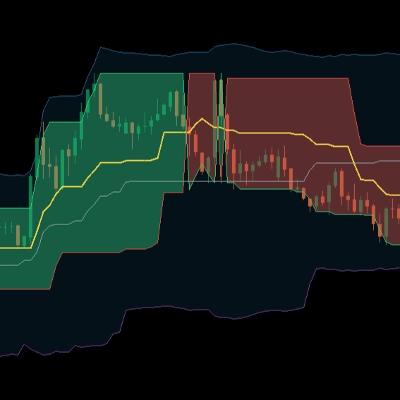
этот индикатор показывает macd на графике.
Сводка
ИИ-сводка
IR Macd on Chart is a trading indicator that displays the Moving Average Convergence Divergence (MACD) directly on the price chart. It provides a visual representation of the MACD, a momentum indicator used to identify trend direction and potential reversals by showing the relationship between two moving averages of a security’s price. This indicator integrates the MACD histogram and signal line within the chart interface, enabling traders to analyze momentum without switching views. It supports standard MACD functionality and is categorized under momentum indicators.
Профиль индикатора
Отзывы покупателей
5.0
Отзывы: 1
5 | 100 % | |
4 | 0 % | |
3 | 0 % | |
2 | 0 % | |
1 | 0 % |
Обсуждение
Частые вопросы
MACD
Продукты, доступные в cTrader Store, включая торговых ботов, индикаторы и плагины, предоставляются сторонними разработчиками и доступны исключительно в информационных и технических целях. cTrader Store не является брокером и не предоставляет инвестиционные консультации, персональные рекомендации или какие-либо гарантии будущей доходности.
Больше от этого автора


Цена
5.13K
Бесплатные установки