present
Registrati e ricevi uno sconto da $50 sul tuo primo acquisto
Trading product for IR Spread Indicatore, image 1
IR Spread
5.0
Recensioni: 2
5.66K
Installazioni gratuite

Descrizione

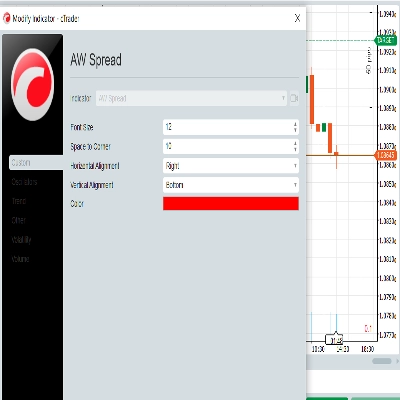
mostra lo spread all'aggiornamento del grafico

Telegram Channel supportaci per più indicatori e bot gratuiti

Riepilogo

Riepilogo AI
IR Spread is a trading indicator designed to display the spread directly on the chart during updates. It provides real-time visualization of the spread, helping traders monitor this key metric within their trading platform interface. The indicator integrates seamlessly with chart updates, ensuring that spread information is current and easily accessible.
Profilo indicatore

Discussioni

Recensioni dei clienti

5.0
Recensioni: 2
5
100 %
4
0 %
3
0 %
2
0 %
1
0 %
Recensioni dei clienti
June 4, 2026
didn't check deep enough so far but it seems perfect and smooth
November 18, 2025

Domande frequenti

I prodotti disponibili tramite cTrader Store, inclusi bot di trading, indicatori e plugin, sono forniti da sviluppatori terzi e resi disponibili esclusivamente a scopo informativo e di accesso tecnico. cTrader Store non è un broker e non fornisce consulenze in materia di investimento, raccomandazioni individualizzate o garanzie di risultati futuri.

Altro da questo autore
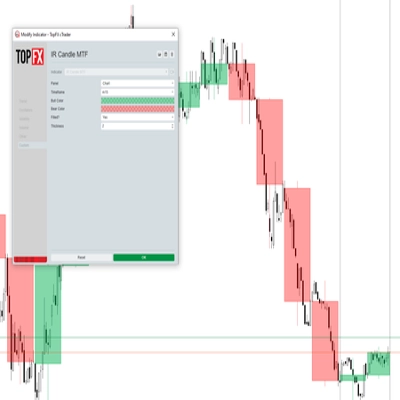
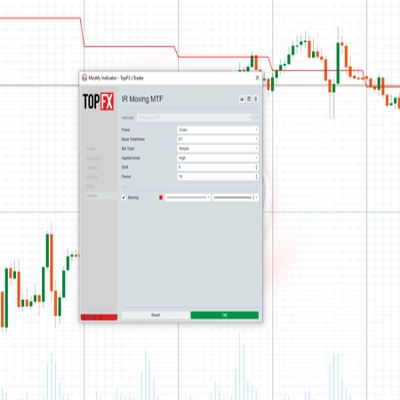
with this indicator you could see other time frame candle in your chart.
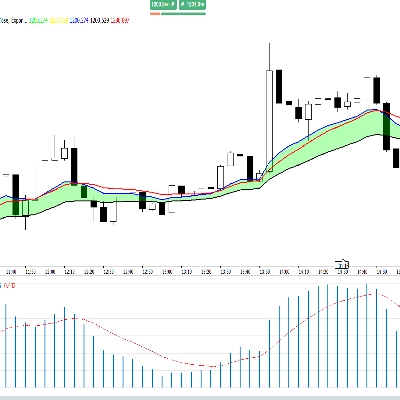
some user add moving average to macd to see better. in ctrader 4.3.11 there is a problem with this . I make a macd tha
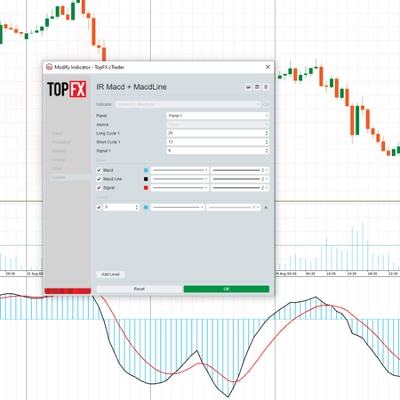
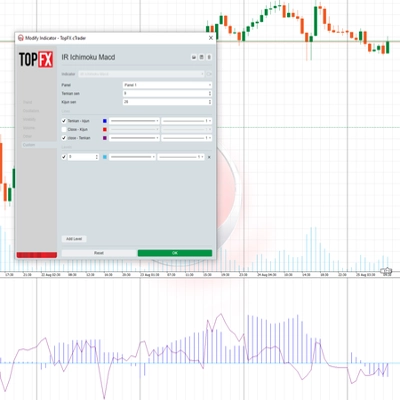
this indicator show macd on chart.
Multi Time Frame Moving Average is a powerful and flexible indicator for cTrader
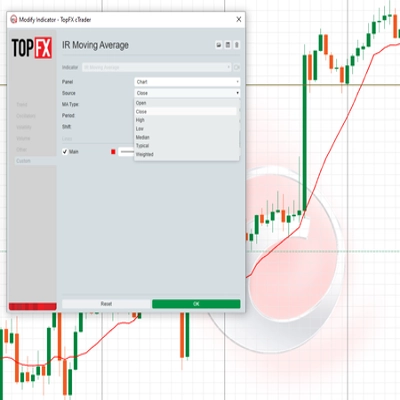
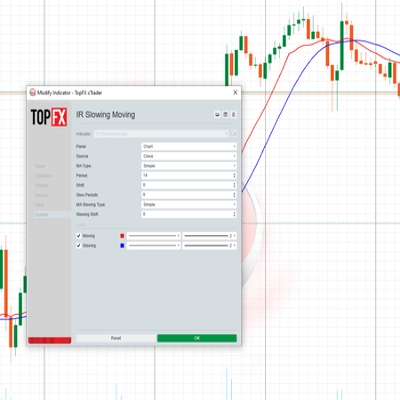
 this moving include everything that a trader needs from Moving Average.
this indicaotr show distance between Tenkan to Kijun, Close to Kijun and Close to Tenkan 
Add Slowing to IR Moving Average.
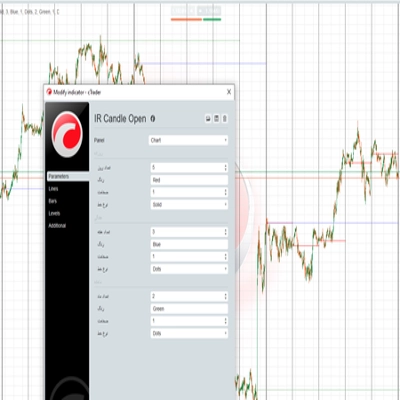
IR Candle Open plots customizable opening price lines for daily, weekly, and monthly candles
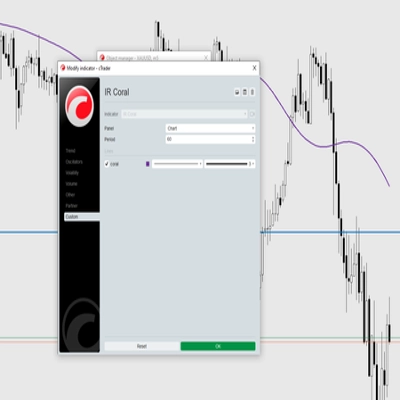
Coral indicator
you could put your check list in your chart you could split your test with “,” you could put your checklist in indicat
this indicator show other time frame close in lower time frame. for ex: show daily close in m 15.
don't move to the end of chart after timeframe changing. it should be better to use for near history. for long history

Potrebbe interessarti anche

PRO Liquidity Sweep + FVG Combo detector with custom Gold/Blue signals & alerts
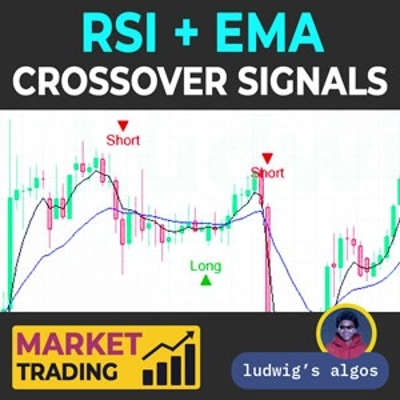
Dual confirmation RSI + EMA crossover signals with visual alerts and dynamic ATR offsets.
Bar Close Alert Manager provides real-time alerts for bar closures with customizable notifications and automation.
Map market structure, order blocks, liquidity and key zones with an interactive cTrader dashboard.
Market structure with BOS and CHoCH, order blocks, and retest buy/sell arrows with entry, stop and two targets
Outlines the first candle of the real session open for indices, forex & crypto. Auto DST, HTF candle panel & EMA.
Logo di "crossover 1"
4.2
(5)
$19
/
$29
Crossover Buy and Sell Alerts and signals
Fractals is a precision-engineered trading indicator for cTrader that reveals the hidden architecture of price action.
GOLD SENTINEL v1.0 - A CANDLE-COLORING INDICATOR FOR GOLD.
Multi-anchor VWAP indicator for cTrader. Plots two VWAP lines (red and blue) with selectable anchors.
VolumeProfileSuite is an advanced and flexible Volume Profile indicator for cTrader.
Don't trust static support and resistance levels, this indicator combines Fibonacci and VWAP in one powerful tool.
cTrader ZigZag Alerts: Precision Swing Detection, Alerts, and Fibonacci.
A function demo version of VWAP indicator with std. dev. bands. Expired on 1st Aug, 2025.
Support Resistance Toolkit
VWAP Set to London Open
🧭 See when your market tends to move—by Month, Day-of-Week, or Hour-of-Day🧭
6-stage IIR filter trend indicator with colored line segments, reversal signals, alerts, and entry arrows.

Prezzo

5.66K
Installazioni gratuite