
Description
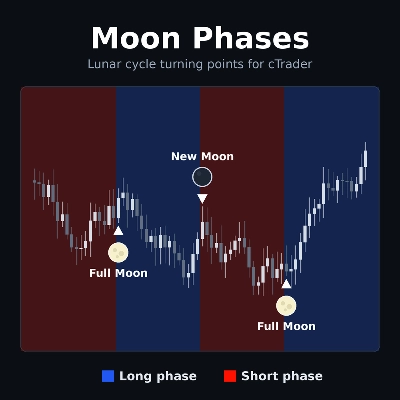
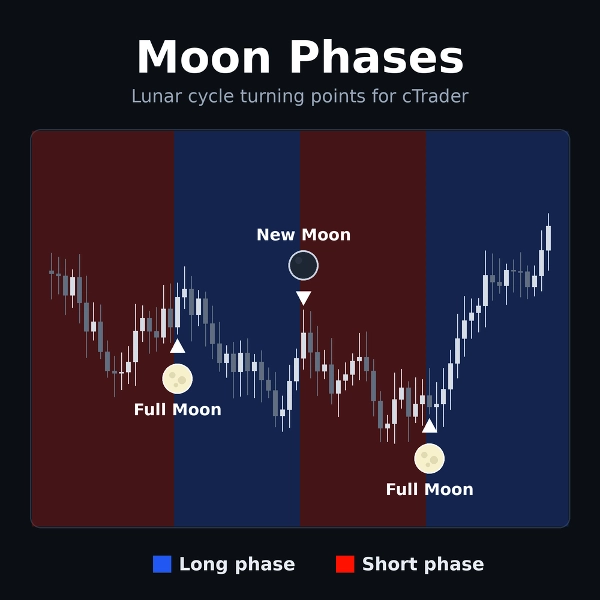
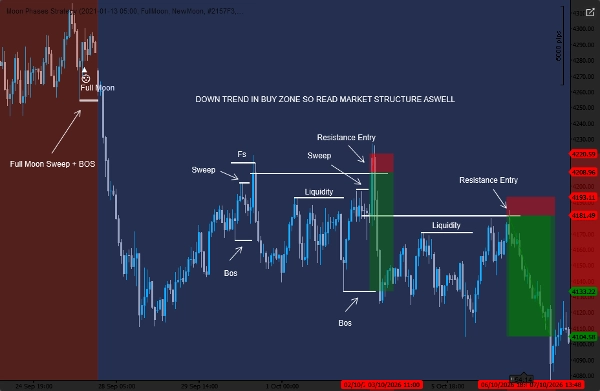
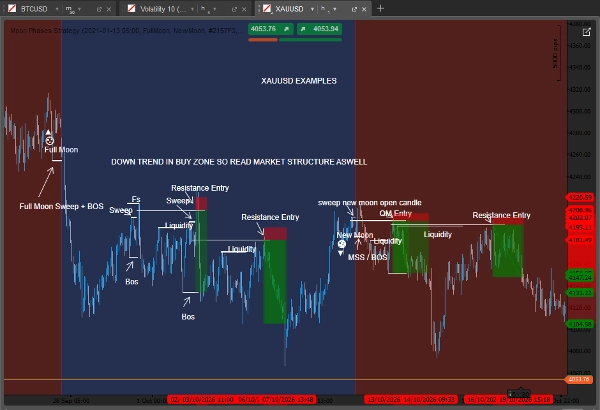
Moon Phases is a time-based cycle indicator for cTrader. It follows the 29.53-day lunar cycle and splits your chart into blue and red phases. Each time the phase flips, it marks the bar with the moon, a label and an arrow.
What it analyses
- It works from the calendar, not from price patterns. Each bar’s date and time is used to work out where it falls in the lunar cycle.
- The phase changes at a new moon or a full moon, depending on your settings.
- Optionally, the Higher Moon and Lower Moon modes compare the close at the last two moon events to decide the phase.
How to read it
- A blue background is the long phase. A red background is the short phase.
- A ▲ arrow with a moon and label below the bar marks a flip to blue.
- A ▼ arrow with a moon and label above the bar marks a flip to red.
- With the default settings, blue starts at the Full Moon and red starts at the New Moon.
- The moons stay fixed on the bar where the flip happened. They don’t move when you scroll or zoom.
Key settings
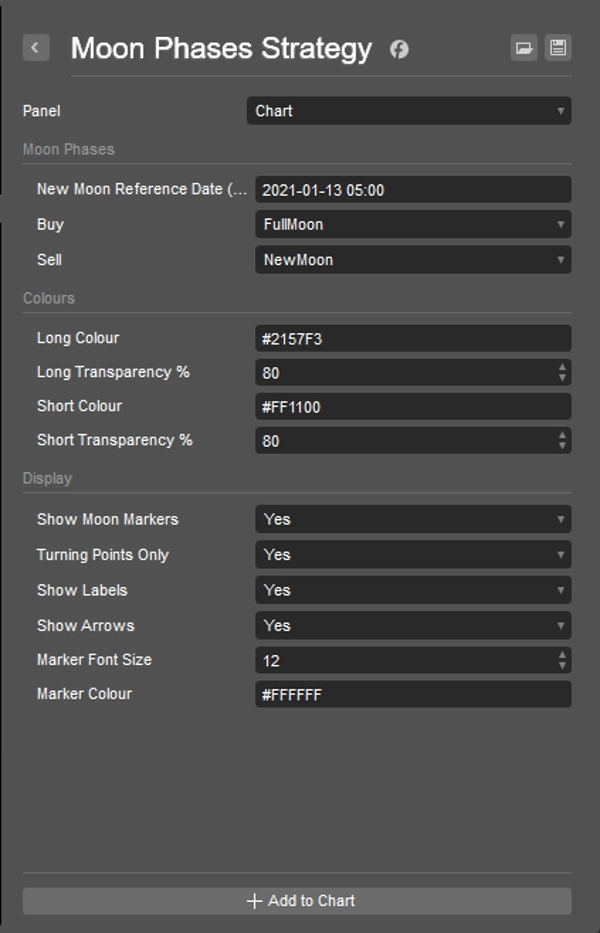
- New Moon Reference Date (UTC): the starting point of the cycle.
- Buy / Sell: choose New Moon, Full Moon, Higher Moon or Lower Moon to decide when the phase flips.
- Long and Short colour and transparency.
- Show Moon Markers, Turning Points Only, Show Labels and Show Arrows.
- Marker font size and marker colour.
Typical use
- Spot cycle turning points on any symbol and timeframe.
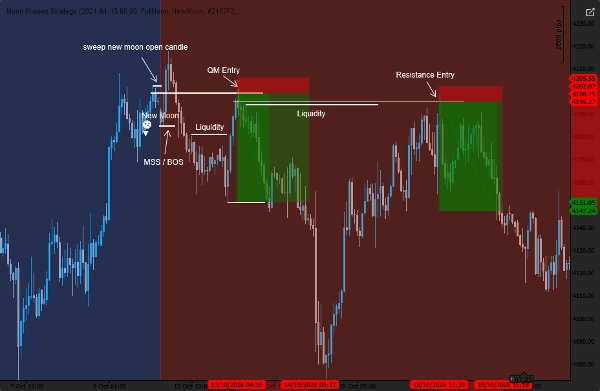
- Scroll back through history and see how price behaved around each flip.
- Use the phases as a timing filter alongside your own strategy.
Best suited for
- Traders who like cycle or time-based analysis and want it on the chart.
- Any experience level, since the indicator is simple to read.
Limitations and notes
- It does not place trades or give advice. It only draws on the chart.
- The phases come from the calendar only. They don’t consider price action, news or volatility, so test them on your own symbols before relying on them.
- On the daily timeframe, a moon can land one bar earlier or later depending on when your broker’s day starts.
- In Higher Moon and Lower Moon mode, the marker on the current bar can change until that bar closes.
- It’s a visual tool, and nothing here guarantees results.
Summary
Indicator profile
Indicator category
Pattern
Output type
Visualisation
Data requirements
Bars only
Supported signals
Reversal
Discussion
Customer reviews
0.0
Reviews: 0
Customer reviews
No reviews for this product yet. Already tried it? Be the first to tell others!
FAQ
Supertrend
Liquidity Grab
Products available through cTrader Store, including trading bots, indicators and plugins, are provided by third-party developers and made available for informational and technical access purposes only. cTrader Store is not a broker and does not provide investment advice, personal recommendations or any guarantee of future performance.
More from this author


Price
1
Sales