
Описание
📈 Стохастический RSI
Индикатор Стохастический RSI — это осциллятор момента, который применяет формулу Стохастика к значениям RSI, а не к цене, что делает его индикатором второго порядка. Он особенно полезен для определения состояний перекупленности и перепроданности с большей чувствительностью, чем стандартный RSI.
🛠️ Параметры
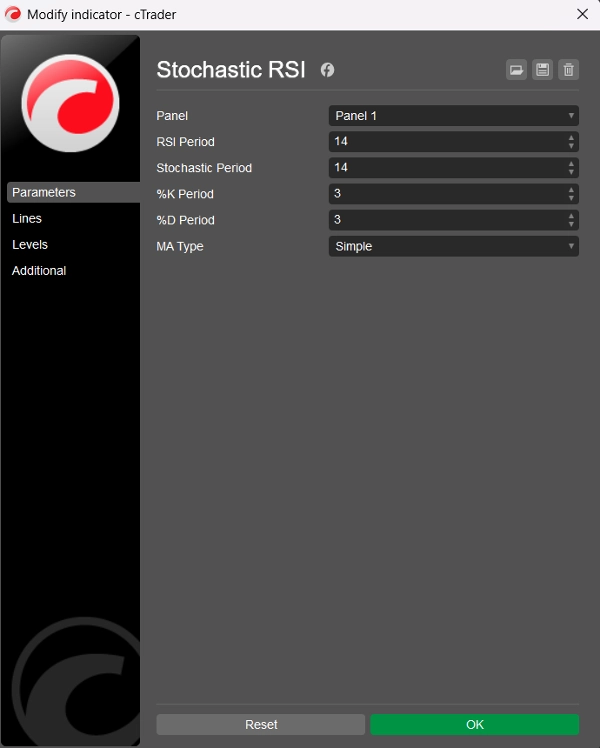
Период RSI: Период обратного отсчёта, используемый для расчёта базового RSI (по умолчанию = 14)
Стохастический период: Период обратного отсчёта, применяемый к значениям RSI для вычисления Стохастического RSI (по умолчанию = 14)
Период %K: Период сглаживания для линии %K (по умолчанию = 3)
Период %D: Период сглаживания для линии %D (по умолчанию = 3)
Тип MA: Тип скользящей средней для сглаживания: выбор из 11 типов (по умолчанию = Простая)
📊 Выходные линии
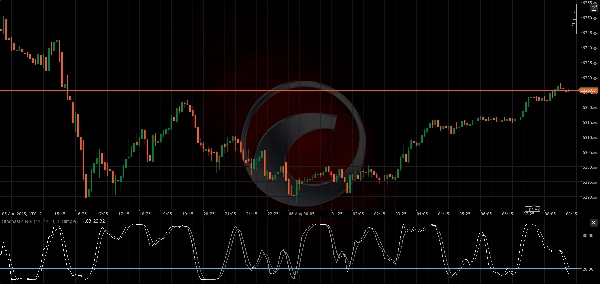
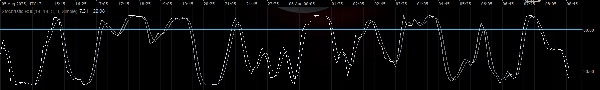
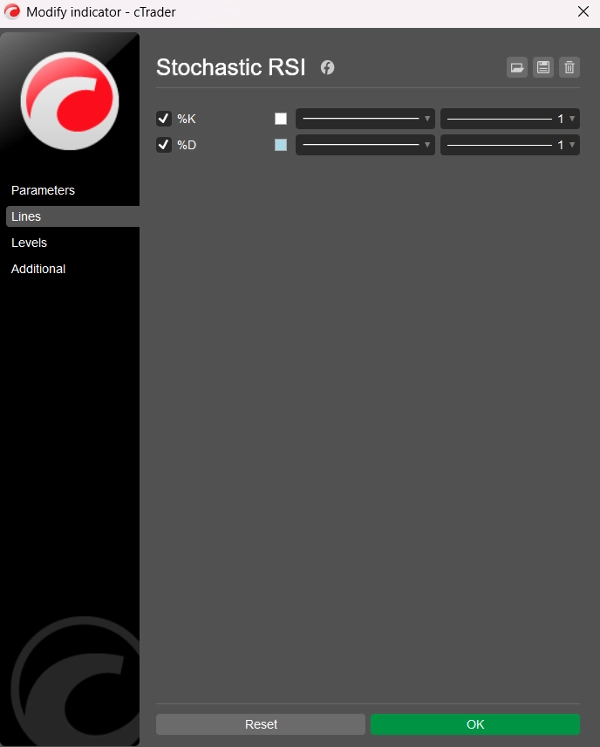
- Линия %K: Сглаженный Стохастический RSI (белый)
- Линия %D: Сглаженная скользящая средняя %K (светло-голубой)
Обe линии колеблются между 0 и 100, что позволяет чётко определять состояния перекупленности и перепроданности.
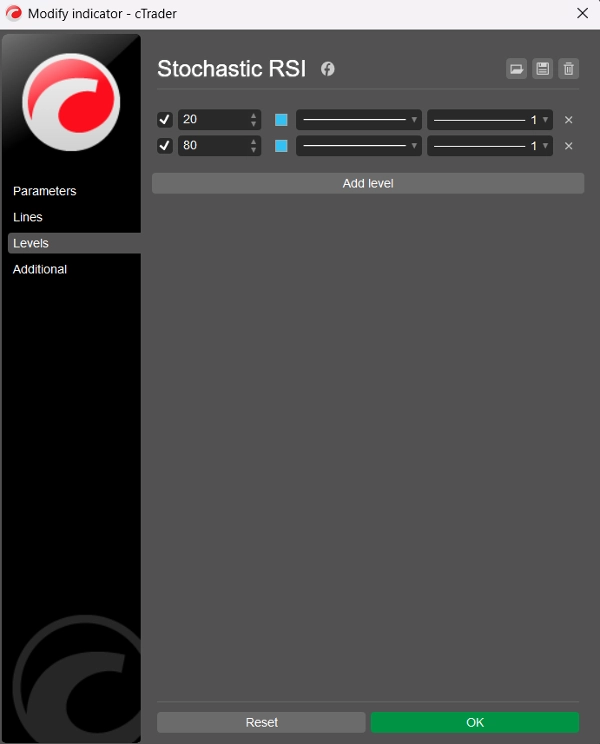
⚠️ Рекомендуемые уровни
Хотя индикатор по умолчанию не отображает статические уровни, пользователям рекомендуется добавить их вручную через вкладку «Уровни» в cTrader:
- Уровень 80 → Перекупленность
- Уровень 20 → Перепроданность
Эти уровни работают аналогично традиционному Стохастическому осциллятору, но применяются к поведению RSI, делая сигналы более чёткими и зачастую более быстрыми.
🧠 Как использовать
- Перекупленность (>80): Может указывать на чрезмерное повышение цены — возможен разворот или консолидация.
- Перепроданность (<20): Может сигнализировать о перепроданности цены — возможен отскок или разворот тренда.
- Пересечения %K и %D: Могут использоваться аналогично Стохастику или MACD — бычье пересечение ниже 20 или медвежье пересечение выше 80 может быть сигналом к действию.
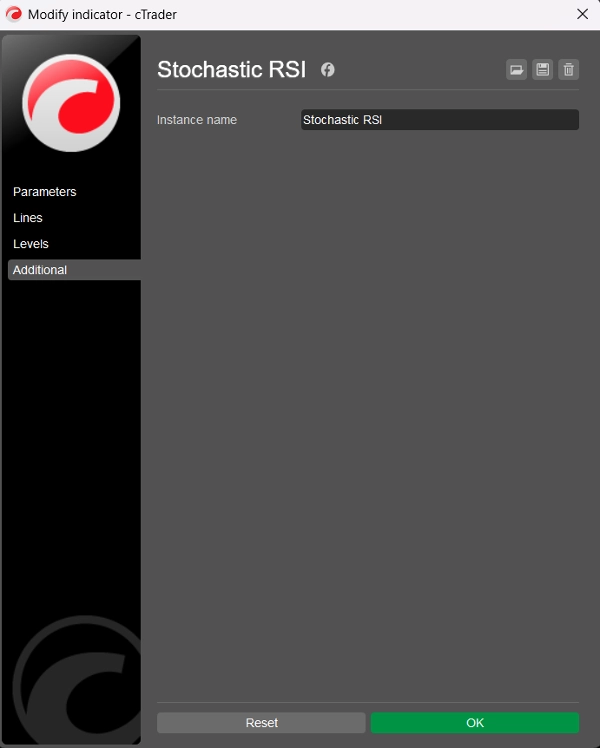
🏷️ Примечания
- Создан для cTrader с использованием C# и Automate API
- Чистый, эффективный и настраиваемый с 11 типами скользящих средних
- Код и логика от BlueRocketBots & ChatGPT (OpenAI)
- Чистый код (всего 99 строк; 54 строки кода, 27 строк текста, 18 пустых строк)
- Улучшенная версия V2
- Бесплатно!
Сводка
Key parameters include the RSI Period (default 14), Stochastic Period (default 14), %K and %D smoothing periods (default 3 each), and a choice among 11 moving average types for smoothing (default is Simple). The indicator outputs two lines: the %K line (smoothed Stochastic RSI) and the %D line (smoothed moving average of %K), both oscillating between 0 and 100.
Suggested manual levels for interpretation are 80 (overbought) and 20 (oversold). Traders may use these levels along with %K and %D crossovers to identify potential price reversals or consolidations. For example, a bullish crossover below 20 or a bearish crossover above 80 can signal actionable market moves.
The indicator is implemented in clean, efficient C# code using the Automate API, allowing customization and integration within cTrader.


