Описание
Надежный индикатор кумулятивного дельта и дисбаланса.
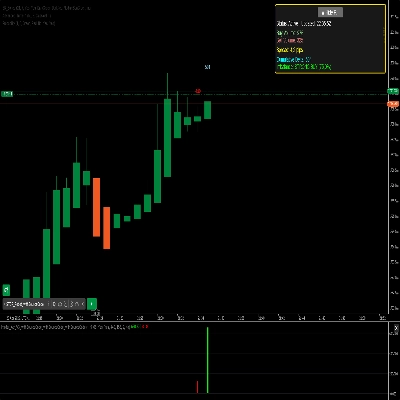
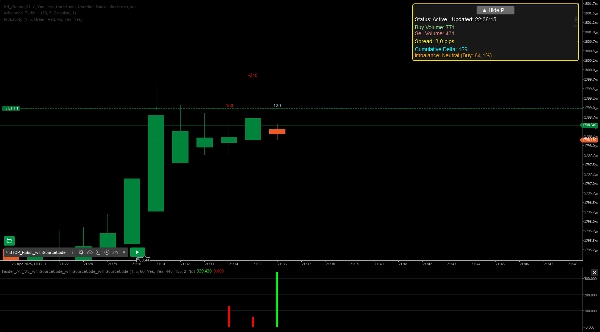
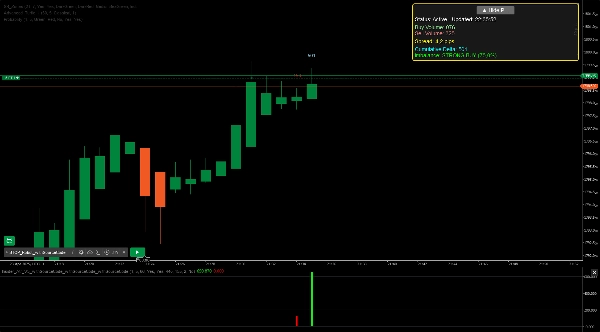
Insider — это надежный индикатор cTrader, предназначенный для анализа данных глубины рынка и выявления дисбалансов покупок и продаж в режиме реального времени. Он обеспечивает четкую визуальную обратную связь на графике, отображая ключевые показатели, такие как объем покупок/продаж, кумулятивная дельта и сила дисбаланса с помощью гистограмм и настраиваемой панели управления. Настройте его под свой стиль торговли с помощью регулируемых параметров, включая период отображения, уровни глубины (1-10) и порог дисбаланса объема (50-95%). Дополнительные функции включают опциональные оповещения о сильных дисбалансах, фильтрацию торговых часов и изменяемую панель для повышения удобства использования. Идеально подходит для дейтрейдеров и свинг-трейдеров, этот индикатор предлагает ценные сведения о настроениях рынка и потенциальных движениях цены.
Сводка
Отзывы покупателей
5 | 100 % | |
4 | 0 % | |
3 | 0 % | |
2 | 0 % | |
1 | 0 % |