
Volume Meter
Индикатор
2 покупки
Версия 1.0, Sep 2025
Windows, Mac
5.0
Отзывы: 1
Описание
📘 Что делает этот индикатор
- Он показывает тик-объем (количество изменений цены за бар) в виде гистограммы.
- На Forex брокеры редко предоставляют реальный объем торгов, поэтому используется тик-объем как замена.
- На акциях/CFD/фьючерсах вы можете получить реальный объем.
- Он накладывает скользящую среднюю объема (по умолчанию 20 периодов).
- Это служит «базовой линией», чтобы быстро определить, является ли объем текущего бара необычно высоким или низким.
🎯 Как использовать для подтверждения
Индикатор не является самостоятельным генератором сигналов. Вместо этого трейдеры используют его для подтверждения настроек из других стратегий:
- Подтверждение пробоя
-
- Если цена пробивает сопротивление сверху или поддержку снизу, проверьте, есть ли у свечи пробоя объем выше её скользящей средней.
- Высокий объем подтверждает, что за движением стоит больше участников → пробой более надежен.
- Пробой с низким объемом = выше вероятность ложного пробоя.
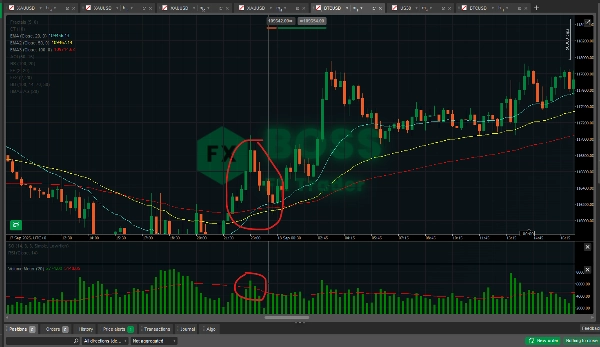
- Продолжение тренда против истощения
-
- В сильном тренде свечи отката часто имеют меньший объем по сравнению с импульсными свечами.
- Если откат происходит при низком объеме, а следующее движение возобновляется с большим объемом → подтверждает продолжение тренда.
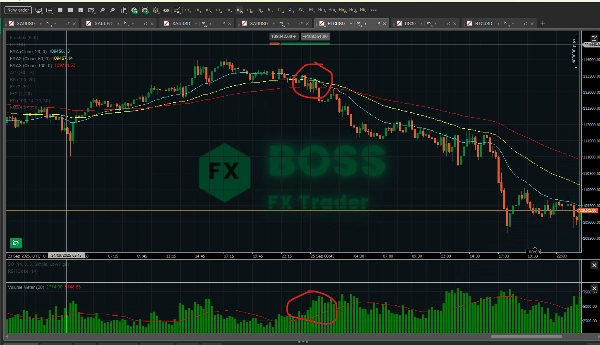
- Если вы видите продолжение трендового движения, но объем падает с каждым толчком → возможно истощение, готовьтесь к развороту.
- Подтверждение разворота
-
- Крупные свечи разворота (пин-бары, поглощения, фракталы) сильнее, если сопровождаются всплеском объема.
- Пример: бычий пин-бар на поддержке с высоким объемом = более сильный сигнал разворота, чем тот же пин-бар при низком объеме.
- Фильтр ложных сигналов
-
- Если ваша основная система дает сигнал на покупку/продажу, но объем слабый (ниже среднего), вы можете отказаться от этой сделки.
- Помогает снизить переигрывание и отфильтровать шум.
📊 Эффективность
- На Forex: тик-объем показал сильную корреляцию с реальным объемом торгов (70–90% корреляции во многих исследованиях). Поэтому он полезен, но не идеален.
- На акциях/фьючерсах/CFD: реальный объем делает индикатор гораздо мощнее, так как вы измеряете фактически торгуемые контракты/акции.
- В качестве подтверждения: лучше всего использовать вместе с ценовым действием и другими индикаторами (например, EMA, RSI, фракталы). Полагаться только на объем рискованно.
- Сильные стороны: подтверждает пробои, фильтрует ложные движения, выявляет истощение.
- Слабые стороны: сам по себе не предсказывает направление — лишь добавляет уверенности при наличии настройки.
✅ Практический совет:
Используйте индикатор как фильтр, а не как триггер. Например:
- Вы видите пересечение EMA (сигнал на покупку).
- Проверьте: объем выше своей скользящей средней? Если да → входите в сделку. Если нет → ждите.
Таким образом вы торгуете только тогда, когда импульс поддерживается участием рынка.
Сводка
ИИ-сводка
Volume Meter is a trading indicator that displays tick volume—the number of price changes per bar—as a histogram. In Forex markets, where real traded volume data is often unavailable, tick volume serves as a proxy, while in stocks, CFDs, and futures, real volume data may be used. The indicator overlays a moving average of volume (default 20-period) to provide a baseline, helping traders identify whether current volume is unusually high or low.
This tool is designed to confirm trading setups rather than generate standalone signals. It assists in validating breakouts by checking if breakout candles have volume above their moving average, indicating stronger market participation. It also helps distinguish trend continuation from exhaustion by comparing volume levels during pullbacks and impulse moves. Additionally, it supports reversal confirmation by highlighting volume spikes on significant reversal candles and filters false signals by advising caution when volume is weak despite buy or sell signals from other systems.
Volume Meter is applicable across various markets including Forex, stocks, indices, commodities, and cryptocurrencies. Its effectiveness is enhanced when combined with price action and other indicators such as EMA or RSI. The indicator aids in improving trade decision confidence by integrating volume analysis as a confirmation and filtering tool.
Профиль индикатора
Отзывы покупателей
5.0
Отзывы: 1
5 | 100 % | |
4 | 0 % | |
3 | 0 % | |
2 | 0 % | |
1 | 0 % |
Отзывы покупателей
October 1, 2025
the first 10 trades should stay boring, and the checklist becomes easier to follow.
Обсуждение
Частые вопросы
BTCUSD
Forex
Breakout
Indices
EURUSD
Commodities
GBPUSD
NZDUSD
Prop
Supertrend
Crypto
Stocks
XAUUSD
NAS100
USDJPY
Продукты, доступные в cTrader Store, включая торговых ботов, индикаторы и плагины, предоставляются сторонними разработчиками и доступны исключительно в информационных и технических целях. cTrader Store не является брокером и не предоставляет инвестиционные консультации, персональные рекомендации или какие-либо гарантии будущей доходности.


![Логотип продукта "Gaussian Channel [Iridio Capital]"](https://cdn.ctrader.com/image/webp/7c039209-5573-4a54-a072-f9528b503103_41960)


Цена
С 29/05/2025
3.04M
Торгуемый объем
45.22K
Выигранные пипы
29
Продажи
771
Бесплатные установки