
RT Consolidation Zones
Индикатор
1 покупки
Версия 1.0, Sep 2024
Windows, Mac
Описание
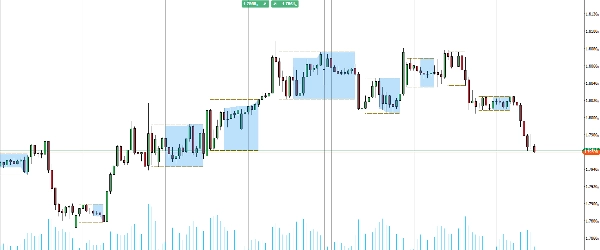
Представляем индикатор Consolidation Zones, созданный, чтобы помочь вам легко выявлять и использовать возможности прорыва.
Этот мощный инструмент выделяет зоны на вашем графике, где цена консолидируется, что упрощает обнаружение потенциальных точек прорыва. Визуализируя эти критические области, вы можете лучше предсказывать движения рынка и принимать более обоснованные торговые решения.
Идеально подходит для трейдеров, стремящихся улучшить свою стратегию с помощью четких и практических идей, обновите свой торговый набор инструментов и овладейте прорывами с индикатором Consolidation Zones.
Сводка
Профиль индикатора
Отзывы покупателей
0.0
Отзывы: 0
Отзывы покупателей
У этого продукта еще нет отзывов. Уже попробовали его? Поделитесь впечатлениями!
Обсуждение
Частые вопросы
BTCUSD
Forex
Breakout
Indices
EURUSD
Commodities
GBPUSD
NZDUSD
Prop
Crypto
Stocks
XAUUSD
NAS100
USDJPY
Продукты, доступные в cTrader Store, включая торговых ботов, индикаторы и плагины, предоставляются сторонними разработчиками и доступны исключительно в информационных и технических целях. cTrader Store не является брокером и не предоставляет инвестиционные консультации, персональные рекомендации или какие-либо гарантии будущей доходности.


Цена
С 25/09/2024
20
Продажи