

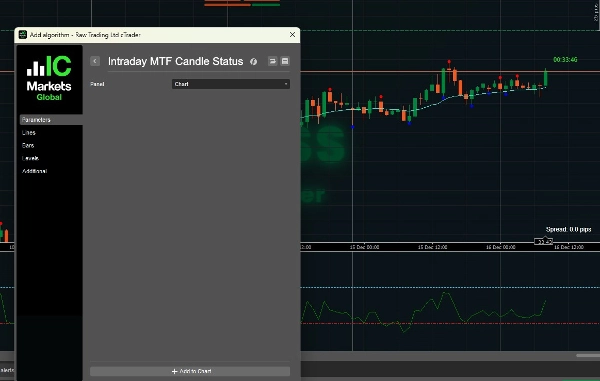
Описание
1️⃣ Что делает этот индикатор?
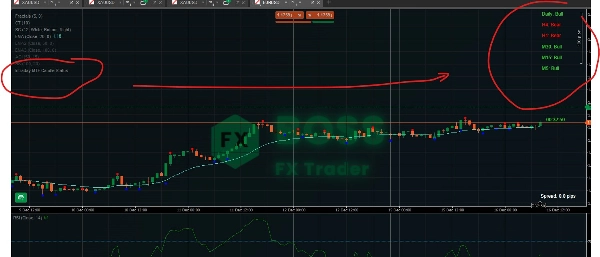
Этот инструмент обобщает направление свечей на нескольких таймфреймах в одном месте на вашем графике.
Для каждого таймфрейма он проверяет последнюю закрытую свечу и отображает:
СтатусЗначение
🟢 Бык
Закрытие > Открытие (покупатели контролируют)
🔴 Медведь
Закрытие < Открытие (продавцы контролируют)
⚪ Доджи
Закрытие ≈ Открытие (неопределённость)
Отображаемые таймфреймы:
- Дневной
- H4
- H1
- M30
- M15
- M5
Все статусы отображаются непосредственно на графике, так что вам не нужно переключать таймфреймы.
2️⃣ Почему этот инструмент мощный
🔥 Решает распространённую проблему трейдера
Большинство трейдеров спрашивают:
«Торговлю я веду по или против тренда на более высоком таймфрейме?»
Этот индикатор отвечает на это мгновенно.
Вместо догадок:
- Вы видите согласование трендов
- Вы избегаете входов против тренда
- Вы улучшаете тайминг и уверенность
3️⃣ Как работает индикатор
📌 Логика статуса свечи
- Использует последнюю закрытую свечу (
Last(1)) - Без перерисовки
- Надёжное подтверждение
📌 Данные с нескольких таймфреймов
- Получает реальные данные свечей с каждого таймфрейма
- Независимо от таймфрейма текущего графика
📌 Отображение на графике
- Рисует текстовые метки в правом верхнем углу
- Цветовая кодировка для мгновенного восприятия
- Обновляется на каждом тике
4️⃣ Как эффективно использовать (торговые сценарии)
🟢 Сценарий 1: Подтверждение тренда (лучший случай использования)
✔ Правило:
Торгуйте только когда таймфреймы высокого и низкого уровней совпадают
Пример:
Дневной: Бык
H4: Бык
H1: Бык
M15: Бык
M5: Бык
✅ Высоковероятная среда для ПОКУПКИ
Используйте:
- Откаты
- Прорывы
- Входы на продолжение
❌ Избегайте ПРОДАЖ здесь
🔴 Сценарий 2: Предупреждение о контртренде
Дневной: Бык
H4: Бык
H1: Медведь
M15: Медведь
M5: Медведь
⚠️ Рынок находится в откате, а не в развороте.
Лучшие действия:
- Ждите, пока M5/M15 снова не станут бычьими
- Избегайте погонь за ПРОДАЖАМИ
- Ищите сигналы на покупку у поддержки
⚪ Сценарий 3: Флет / Боковой рынок
Дневной: Бык
H4: Доджи
H1: Доджи
M15: Медведь
M5: Бык
🚫 Низкокачественные условия
Рекомендуется:
- Уменьшить размер позиции
- Избегать сделок на прорыв
- Ждать ясности структуры
5️⃣ Пример стратегии скальпинга (входы на M5)
🔹 Идеальный сигнал на покупку
- Дневной → Бык
- H4 → Бык
- H1 → Бык
- M15 → Бык
- M5 → Медведь → становится Быком
📍 Вход:
- Когда M5 снова переключается на Быка
- Комбинируйте с:
-
- Поддержкой
- Фракталами
- EMA / VWAP
🔹 Идеальный сигнал на продажу
Обратная логика:
- Таймфреймы выше → Медведь
- Вход на завершении отката на M5
6️⃣ Лучшие комбинации таймфреймов
Стиль торговлиФокус на таймфреймах
Скальпинг
H1 → M15 → M5
Интрадей
H4 → H1 → M15
Свинг
Дневной → H4 → H1
7️⃣ Чем этот инструмент НЕ является
🚫 Не является сигналом для входа сам по себе
🚫 Не индикатором разворота
🚫 Не заменяет структуру / ценовое действие
✅ Это инструмент для определения направления и подтверждения
8️⃣ Лучшие индикаторы для сочетания
Настоятельно рекомендуемые сочетания:
- ✅ Фракталы (вы уже используете)
- ✅ Структура рынка (HH / LL)
- ✅ Поддержка и сопротивление
- ✅ EMA 50 / EMA 200
- ✅ VWAP
9️⃣ Профессиональные правила торговли с этим инструментом
✔ Торгуйте только в направлении HTF
✔ Используйте LTF только для тайминга входа
✔ Игнорируйте сигналы, когда Дневной и H4 не совпадают
✔ Не переусердствуйте при смешанных сигналах
✔ Позвольте структуре подтвердить направление свечи
🔟 Итоговое резюме
IntradyMultiTimeframeCandleStatus = Панель рыночного направления
Он даёт вам:
- Мгновенную ясность тренда
- Сделки с большей вероятностью успеха
- Меньше эмоциональных решений
- Более чистое исполнение
Ознакомьтесь с нашим продуктом.
Сводка
Отзывы покупателей
5 | 100 % | |
4 | 0 % | |
3 | 0 % | |
2 | 0 % | |
1 | 0 % |


![Логотип продукта "[Stellar Strategies] MARSI Signal Plotter"](https://cdn.ctrader.com/image/webp/7b2b8da6-8f8e-4646-8d4a-4710c516c01e_25567)


