
Area of Interest
Indicateur
2 achats
Version 1.0, Aug 2025
Windows, Mac
4.0
Avis : 2
Depuis le 29/05/2025
3.04M
Volume tradé
45.22K
Pips gagnés
29
Ventes
769
Installations gratuites
Description
1. Objectif de l'indicateur
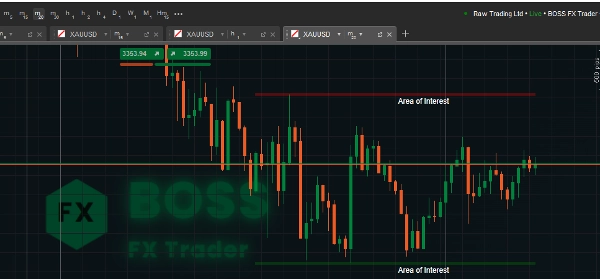
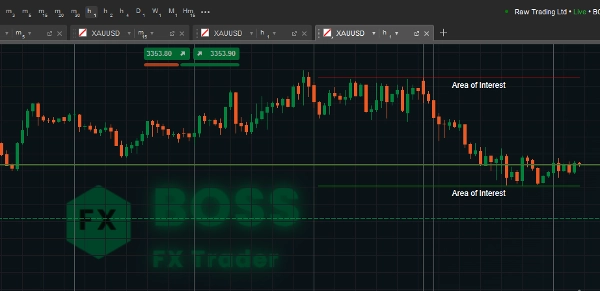
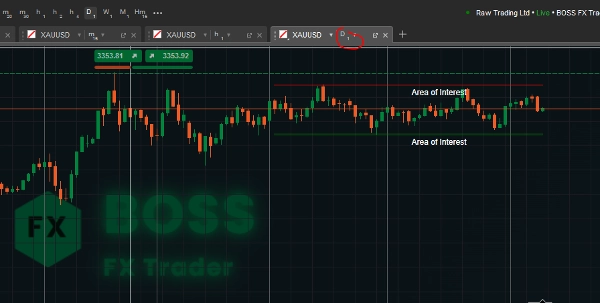
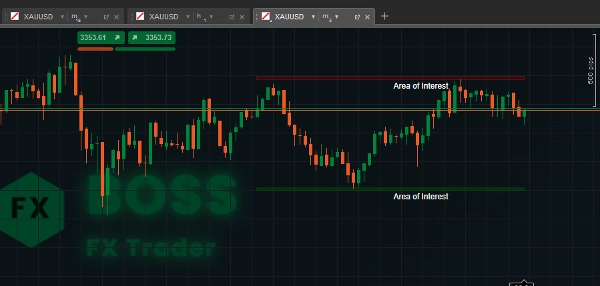
Cet indicateur Area of Interest de cTrader identifie les zones de support et de résistance sur une période de retour définie par l'utilisateur, et les met visuellement en évidence comme « Zones d'intérêt » sur votre graphique.
Il aide les traders à voir rapidement les niveaux de prix clés où les retournements ou les cassures sont plus susceptibles de se produire.
2. Fonctionnement du code
- Période de retour – Le nombre de barres (chandeliers) précédentes que l'indicateur analysera pour trouver le plus haut sommet et le plus bas creux.
- Valeurs plus élevées → zones plus larges.
- Valeurs plus basses → niveaux plus récents.
- Hauteur de la zone – La taille verticale (épaisseur) de la zone de support/résistance en pips.
- Aide à rendre la zone plus visible et ajustable.
- Efface les anciens tracés avant d'en dessiner de nouveaux pour éviter l'encombrement.
- Collecte les prix hauts et bas pour la plage de retour.
- Trouve les niveaux de prix les plus hauts et les plus bas (résistance & support).
- Convertit la hauteur de la zone de pips en valeur de prix réelle.
3. Instructions d'utilisation
- Attacher l'indicateur
-
- Ouvrez cTrader, chargez un graphique, cliquez sur Indicators → Custom → AreaOfInterest.
- Ajuster les paramètres
-
- Période de retour :
-
- Pour le swing trading → Utilisez des valeurs plus grandes (par ex., 100–200).
- Pour le scalping → Utilisez des valeurs plus petites (par ex., 20–50).
- Hauteur de la zone : Ajustez selon votre style de trading et la volatilité de l'instrument.
- Interprétation des zones
-
- Zone rouge (Résistance) – Le prix a tendance à inverser ou ralentir en entrant dans cette zone.
- Zone verte (Support) – Le prix rebondit souvent vers le haut à partir d'ici.
- Recherchez :
-
- Rejet de prix
- Modèles de chandeliers (pin bars, engulfing)
- Confluence avec d'autres indicateurs (EMA, RSI, Fibonacci)
- Exemples de trading
-
- Trade de rebond : Entrez long près de la zone verte avec un stop juste en dessous.
- Trade de cassure : Attendez que les prix clôturent au-dessus de la zone rouge pour une cassure haussière.
- Détection de fausse cassure : Surveillez les mèches au-delà de la zone mais fermées à l'intérieur (possibles retournements).
Un trader rentable a utilisé cet outil.
Résumé
Résumé IA
Area of Interest is a cTrader indicator designed to identify and visually highlight key support and resistance zones on trading charts. It scans a user-defined lookback period to detect the highest highs and lowest lows, marking these as “Areas of Interest” to help traders recognize price levels where reversals or breakouts are more likely. Users can adjust the lookback period to focus on broader historical zones or more recent price levels, and set the vertical size (zone height) of these areas in pips for better visibility. The indicator clears previous drawings before plotting new zones to maintain chart clarity. Resistance zones are displayed in red, indicating potential price reversals or slowdowns, while support zones appear in green, suggesting possible price bounces. Traders can use these zones alongside price action signals such as candlestick patterns and other technical indicators to inform trading decisions. Typical applications include entering long positions near support zones, trading breakouts above resistance zones, and detecting false breakouts by observing price wicks relative to the zones. The indicator supports customization to suit different trading styles, including scalping and swing trading, by adjusting the lookback period and zone height parameters.
Profil de l'indicateur
Avis clients
4.0
Avis : 2
5 | 0 % | |
4 | 100 % | |
3 | 0 % | |
2 | 0 % | |
1 | 0 % |
Discussion
Questions fréquentes
Les produits disponibles sur cTrader Store, notamment les bots de trading, les indicateurs et les plug-ins, sont fournis par des développeurs tiers et mis à disposition à titre informatif et à des fins d'accès technique uniquement. cTrader Store n'est pas un courtier et ne fournit aucun conseil en investissement, aucune recommandation personnelle ni aucune garantie quant aux performances futures.


Prix
Depuis le 29/05/2025
3.04M
Volume tradé
45.22K
Pips gagnés
29
Ventes
769
Installations gratuites