

Description
📌 Détecteur de BIAIS du Marché — Description
Le Détecteur de BIAIS du Marché est un assistant de trading intelligent conçu pour identifier si le marché penche vers un Biais Achat, un Biais Vente, ou un Biais Neutre. Il analyse pour déterminer la structure dominante du marché.
Avec une logique IA intégrée, l’outil n’évalue pas seulement l’action des prix par rapport aux conditions de tendance, mais s’adapte également au fil du temps en apprenant du comportement du marché. Cela aide à filtrer les faux signaux, augmente la précision et fournit aux traders une direction de marché exploitable en un coup d’œil.
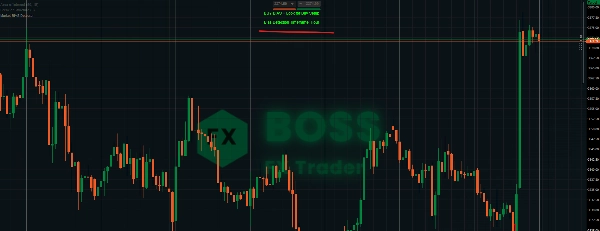
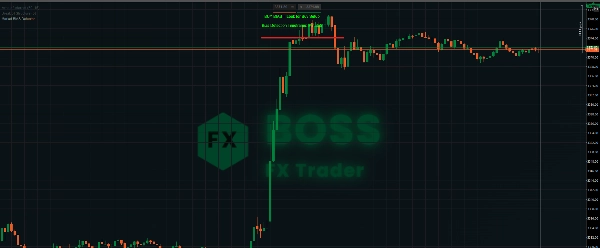
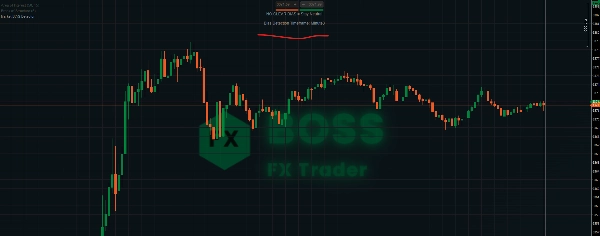
L’outil élimine les conjectures en affichant un message clair de biais sur votre graphique :
- ✅ BIAS D’ACHAT → Recherchez uniquement des configurations d’achat.
- ❌ BIAS DE VENTE → Recherchez uniquement des configurations de vente.
- ⚪ PAS DE BIAIS CLAIR → Restez neutre et attendez une confirmation.
⚙️ Comment l’utiliser
- Appliquez l’indicateur à votre graphique.
-
- Une fois chargé, il calculera automatiquement le biais.
- Aucune saisie manuelle n’est requise si le panneau est masqué.
- Lisez le résultat :
-
- Le message apparaîtra sur le graphique montrant le biais actuel du marché (Achat, Vente ou Neutre).
- Il affiche également la période que vous analysez, afin que vous connaissiez le contexte du biais.
- Stratégie de trading :
-
- Lorsque l’indicateur affiche BIAS D’ACHAT, planifiez uniquement des trades longs (configurations d’achat).
- Lorsqu’il affiche BIAS DE VENTE, planifiez uniquement des trades courts (configurations de vente).
- Restez patient pendant les conditions Neutres jusqu’à ce que le biais devienne clair.
- Confirmation Multi-Périodes (Optionnel) :
-
- Utilisez le Détecteur de BIAIS du Marché sur des périodes plus longues (H1, H4, D1) pour confirmer la direction de la tendance à long terme.
- Combinez avec des entrées sur des périodes plus courtes pour des trades précis.
🤖 Intégration de l’IA dans l’outil
L’IA est intégrée dans le Détecteur de BIAIS du Marché de la manière suivante :
- Reconnaissance de motifs : L’IA aide à reconnaître les motifs de prix récurrents pour réduire les faux changements de biais.
- Filtrage adaptatif : Au lieu de règles rigides, l’IA s’adapte aux différentes conditions de marché (tendance, range, volatilité) en pondérant dynamiquement les relations EMA et Hull.
- Réduction du bruit : En analysant les données historiques, l’IA filtre les petites fluctuations qui pourraient induire en erreur les indicateurs standards.
- Support à la décision : La logique IA affine la sortie du biais afin que les traders puissent se concentrer uniquement sur les configurations à haute probabilité.
✨ En résumé, le Détecteur de BIAIS du Marché combine l’analyse technique classique et avancée avec un filtrage alimenté par IA pour offrir aux traders un outil fiable de direction du marché, réduisant les conjectures et améliorant la cohérence des trades.
Résumé
Avis clients
5 | 100 % | |
4 | 0 % | |
3 | 0 % | |
2 | 0 % | |
1 | 0 % |


