

Description
1️⃣ Que fait cet indicateur ?
Cet outil résume la direction des chandeliers sur plusieurs unités de temps en un seul endroit sur votre graphique.
Pour chaque unité de temps, il vérifie la dernière bougie fermée et affiche :
StatutSignification
🟢 Haussier
Fermeture > Ouverture (acheteurs aux commandes)
🔴 Baissier
Fermeture < Ouverture (vendeurs aux commandes)
⚪ Doji
Fermeture ≈ Ouverture (indécision)
Unités de temps affichées :
- Journalier
- H4
- H1
- M30
- M15
- M5
Tous les statuts sont affichés directement sur le graphique, vous n’avez donc pas besoin de changer d’unité de temps.
2️⃣ Pourquoi cet outil est puissant
🔥 Résout un problème courant des traders
La plupart des traders se demandent :
« Est-ce que je trade dans le sens ou contre la tendance de l’unité de temps supérieure ? »
Cet indicateur répond à cela immédiatement.
Au lieu de deviner :
- Vous voyez l’alignement des tendances
- Vous évitez les entrées contre-tendance
- Vous améliorez le timing et la confiance
3️⃣ Comment fonctionne l’indicateur
📌 Logique du statut de la bougie
- Utilise la dernière bougie fermée (
Last(1)) - Pas de repaint
- Confirmation fiable
📌 Données multi-unités de temps
- Récupère les données réelles des chandeliers pour chaque unité de temps
- Indépendant de l’unité de temps du graphique sur lequel vous êtes
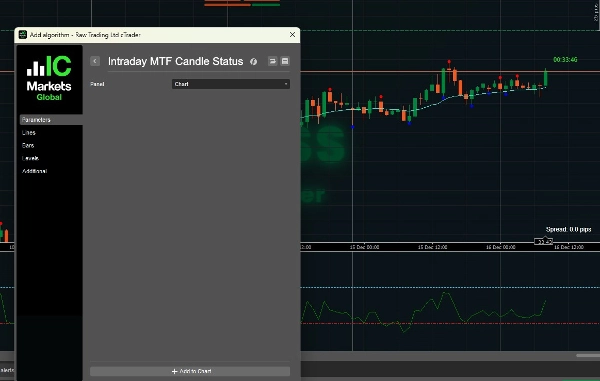
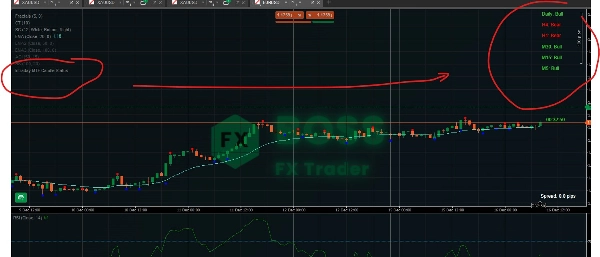
📌 Affichage sur le graphique
- Affiche des étiquettes textuelles dans la zone en haut à droite
- Codé par couleur pour une lecture instantanée
- Mis à jour à chaque tick
4️⃣ Comment l’utiliser efficacement (scénarios de trading)
🟢 Scénario 1 : Confirmation de tendance (meilleure utilisation)
✔ Règle :
Tradez uniquement lorsque les unités de temps supérieures et inférieures sont d’accord
Exemple :
Journalier : Haussier
H4 : Haussier
H1 : Haussier
M15 : Haussier
M5 : Haussier
✅ Environnement d’achat à haute probabilité
Utilisez :
- Les replis
- Les cassures
- Les entrées de continuation
❌ Évitez les ventes ici
🔴 Scénario 2 : Avertissement contre-tendance
Journalier : Haussier
H4 : Haussier
H1 : Baissier
M15 : Baissier
M5 : Baissier
⚠️ Le marché est en repli, pas en retournement.
Meilleures actions :
- Attendez que M5/M15 redeviennent haussiers
- Évitez de courir après les ventes
- Cherchez des configurations d’achat au support
⚪ Scénario 3 : Marché choppy / en range
Journalier : Haussier
H4 : Doji
H1 : Doji
M15 : Baissier
M5 : Haussier
🚫 Conditions de faible qualité
Recommandé :
- Réduisez la taille de position
- Évitez les trades de cassure
- Attendez la clarté de la structure
5️⃣ Exemple de stratégie de scalping (entrées M5)
🔹 Configuration d’achat idéale
- Journalier → Haussier
- H4 → Haussier
- H1 → Haussier
- M15 → Haussier
- M5 → Baissier → devient Haussier
📍 Entrée :
- Quand M5 repasse en Haussier
- Combinez avec :
-
- Support
- Fractales
- EMA / VWAP
🔹 Configuration de vente idéale
Logique inverse :
- Unités de temps supérieures → Baissier
- Entrer à la fin du repli sur M5
6️⃣ Meilleures combinaisons d’unités de temps
Style de tradingUnités de temps ciblées
Scalping
H1 → M15 → M5
Intraday
H4 → H1 → M15
Swing
Journalier → H4 → H1
7️⃣ Ce que cet outil n’est PAS
🚫 Pas un signal d’entrée en soi
🚫 Pas un indicateur de retournement
🚫 Pas un remplacement pour la structure / l’action des prix
✅ C’est un outil de biais et de confirmation
8️⃣ Meilleurs indicateurs à combiner
Associations fortement recommandées :
- ✅ Fractales (vous les utilisez déjà)
- ✅ Structure du marché (HH / LL)
- ✅ Support & Résistance
- ✅ EMA 50 / EMA 200
- ✅ VWAP
9️⃣ Règles de trading pro avec cet outil
✔ Tradez uniquement dans la direction de l’UT supérieure
✔ Utilisez l’UT inférieure seulement pour le timing d’entrée
✔ Ignorez les signaux quand le Journalier et le H4 ne sont pas d’accord
✔ Ne pas surtrader lors de signaux mixtes
✔ Laissez la structure confirmer le biais de la bougie
🔟 Résumé final
IntradyMultiTimeframeCandleStatus = Tableau de bord du biais de marché
Il vous offre :
- Clarté instantanée de la tendance
- Trades à probabilité plus élevée
- Décisions moins émotionnelles
- Exécution plus propre
Découvrez notre produit.
Résumé
Avis clients
5 | 100 % | |
4 | 0 % | |
3 | 0 % | |
2 | 0 % | |
1 | 0 % |


