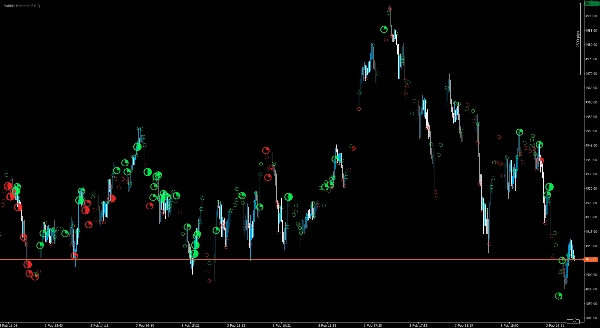
Delta Peak Bubbles is built for traders who want a fast, visual way to identify “where the market is doing the work” on tick charts. Instead of cluttering your screen with extra panels, it draws clear, graded bubbles directly on the chart to reveal high‑intensity bursts of activity in real time.
The indicator focuses on peak moments within each bar and visualizes them with an easy‑to-read strength scale (from subtle circles up to a standout star for the strongest events). Bubbles are color‑coded for quick directional context, making it simple to distinguish bullish vs. bearish pressure at a glance.
Designed for practical trading workflows, Delta Peak Bubbles works especially well for:
- Scalping and short‑term momentum trading
- Breakout confirmation and impulse tracking
- Identifying reaction zones and potential exhaustion points
- Adding a “heat layer” to Price Action / SMC / key level strategies
Bubble strength guide
Bubbles are graded into four strength levels to help you quickly separate normal activity from high‑impact spikes:
- Level 1 – Low:
○(minor spike) - Level 2 – Medium:
◔(moderate spike) - Level 3 – High:
◑(strong spike) - Level 4 – Extreme:
★(very strong / standout spike)
Color indicates directional pressure (green = bullish, red = bearish).
Display controls make it clean on any layout, including 4K monitors, so you can keep your chart readable while still seeing the important moments.
Disclaimer: Trading/Investing involves substantial risk and may result in the loss of all invested capital. This indicator is provided for informational and analytical purposes only and does not constitute financial advice, an offer, or a recommendation. Use is at your own risk; you remain solely responsible for all trading decisions and outcomes. The provider makes no representations or warranties (express or implied) regarding accuracy, completeness, timeliness, performance, merchantability, or fitness for a particular purpose. To the fullest extent permitted by law, the provider shall not be liable for any direct or indirect losses, damages, or lost profits arising from or related to the use of this indicator (including, without limitation, losses due to market conditions, data/platform issues, configuration errors, or misuse). Past performance is not a reliable indicator of future results.


![Logo de "[Stellar Strategies] BOS Trend 1.0"](https://market-prod-23f4d22-e289.s3.amazonaws.com/808c7722-ba53-4633-b8a4-16f31eeb1fc2_[Stellar Strategies] BOS Trend.jpg)

.png)


