present
ลงทะเบียนและรับส่วนลด $50 สำหรับการซื้อครั้งแรกของคุณ
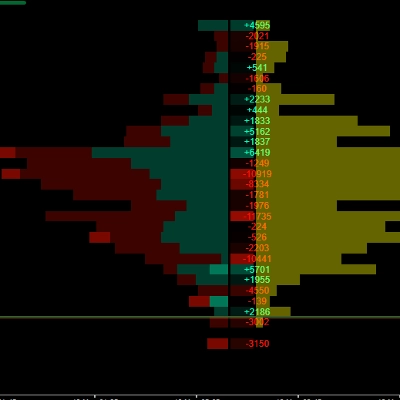
Trading product for HeatmapLiquidityZones อินดิเคเตอร์ Key Levels Volume, image 1
HeatmapLiquidityZones
อินดิเคเตอร์
1 การซื้อ
เวอร์ชัน 1.0, May 2026
Windows, Mac
5.0
รีวิว: 2
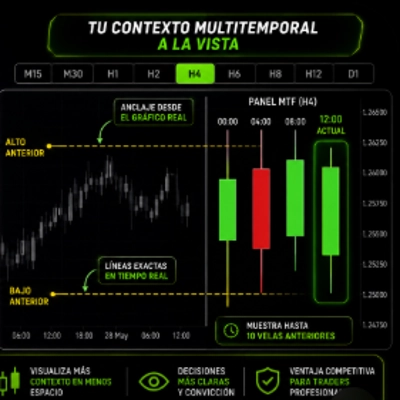
Trading product for HeatmapLiquidityZones อินดิเคเตอร์ Key Levels Volume, image 2
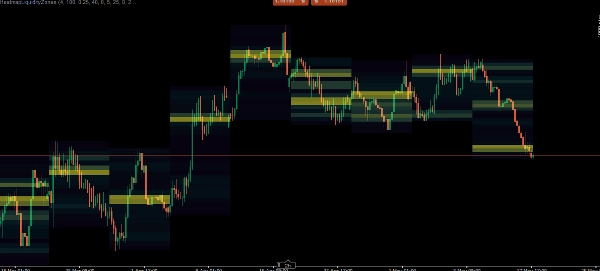
Trading product for HeatmapLiquidityZones อินดิเคเตอร์ Key Levels Volume, image 3
28
การขาย
576
ติดตั้งฟรี

คำอธิบาย

โซนสภาพคล่องแบบฮีทแมป

แสดงปริมาณตามราคา ค้นหาการสนับสนุน/ต้านทานที่ซ่อนอยู่ และติดตามสภาพคล่องของตลาดแบบเรียลไทม์


ตัวบ่งชี้โซนสภาพคล่องแบบฮีทแมปเป็นเครื่องมือวิเคราะห์ปริมาณที่ทรงพลังซึ่งแปลงข้อมูลตลาดดิบเป็นฮีทแมปภาพที่เข้าใจง่าย โดยการวิเคราะห์ปริมาณการเทรดในช่วงเวลาที่สูงขึ้น (HTF) มันจะระบุได้อย่างแม่นยำว่ามีแรงซื้อและแรงขายที่สำคัญที่สุดอยู่ที่ใด


แทนที่จะเดาว่าตลาดอาจกลับตัวที่ไหน ตัวบ่งชี้นี้จะวางระดับสภาพคล่องที่มีปริมาณรองรับอย่างแม่นยำ ระดับเหล่านี้จะขยายไปข้างหน้าอย่างไดนามิกและจะหายไปโดยอัตโนมัติเมื่อราคาทะลุและทำให้ระดับนั้นไม่ถูกต้อง ช่วยให้กราฟของคุณสะอาดและเกี่ยวข้องกับการเคลื่อนไหวของราคาปัจจุบันเท่านั้น


คุณสมบัติหลัก

ฮีทแมปหลายช่วงเวลา: เลือกช่วงเวลาขนาดใหญ่ที่คุณต้องการ (1H, 4H, รายวัน, รายสัปดาห์ หรือรายเดือน) ตัวบ่งชี้จะทำแผนที่การกระจายปริมาณสำหรับช่วงเวลานั้นโดยตรงบนกราฟช่วงเวลาที่ต่ำกว่าของคุณ


การแบ่ง ATR แบบไดนามิก: มาตราส่วนราคาจะถูกแบ่งเป็น "บ็อกซ์" (โซน) แบบไดนามิกซึ่งคำนวณโดยใช้ค่าเฉลี่ยช่วงจริง (ATR) ซึ่งช่วยให้ฮีทแมปปรับตัวอย่างชาญฉลาดกับตลาดที่มีความผันผวนสูงและตลาดที่รวมตัวอย่างแน่นหนา


ระดับสภาพคล่องที่ยกเลิกอัตโนมัติ: เมื่อบ็อกซ์ราคาหนึ่งสะสมปริมาณจำนวนมาก มันจะกลายเป็น "ระดับสภาพคล่อง" ตัวบ่งชี้จะวาดเส้นทึบที่ขยายไปข้างหน้า หากราคาทะลุผ่านระดับนี้ได้สำเร็จ เส้นนั้นจะถูกลบออกโดยอัตโนมัติ (ยกเลิก)


การไล่ระดับสีความหนาแน่น: แยกแยะด้วยสายตาระหว่างจุดปริมาณต่ำ กลาง และสูง ฮีทแมปใช้การไล่ระดับสีเพื่อแสดงให้คุณเห็นอย่างชัดเจนว่าปริมาณที่หนักที่สุดถูกจับอยู่ที่ใด


การติดตามเปอร์เซ็นต์: ระดับสภาพคล่องที่มีความหนาแน่นสูงจะแสดงป้ายเปอร์เซ็นต์ (เช่น 85%) แสดงให้เห็นอย่างชัดเจนว่าจุดนั้นแข็งแกร่งเพียงใดเมื่อเทียบกับปริมาณในช่วงเวลา HTF ที่เหลือ

สรุป

สรุปโดย AI
Heatmap Liquidity Zones is a volume profiling indicator designed to visualize volume-at-price and identify key liquidity levels that act as hidden support and resistance zones. It analyzes tick volume on selected higher timeframes (1H, 4H, Daily, Weekly, Monthly) and projects this volume distribution onto lower timeframe charts, providing a multi-timeframe perspective.

The indicator segments the price scale into dynamic zones based on the Average True Range (ATR), adapting to market volatility. It highlights significant volume clusters as liquidity levels with solid lines extending forward. These lines automatically disappear if the price breaks through the level, ensuring the chart remains focused on relevant, current price action.

A color gradient visually distinguishes low, medium, and high volume nodes, while percentage labels indicate the relative strength of high-density liquidity levels within the chosen timeframe. This tool supports traders in tracking market liquidity in real-time and making volume-backed decisions regarding support and resistance areas.
โปรไฟล์อินดิเคเตอร์

รีวิวจากลูกค้า

5.0
รีวิว: 2
5
100 %
4
0 %
3
0 %
2
0 %
1
0 %
รีวิวจากลูกค้า
May 22, 2026
Heatmap Liquidity Zones is a strong liquidity visualization tool that highlights volume concentration areas and dynamically tracks important market zones. The adaptive ATR-based heatmap works well across different volatility conditions, while auto-invalidating levels help keep the chart clean. A useful indicator for traders focused on liquidity, market structure, and context-based decision making.
May 22, 2026

การสนทนา

คำถามที่พบบ่อย

Key Levels
Volume
ATR
Support & Resistance
ผลิตภัณฑ์ที่มีให้บริการผ่าน cTrader Store รวมถึงบอทการเทรด อินดิเคเตอร์ และปลั๊กอิน มีให้บริการโดยนักพัฒนาบุคคลที่สามและมีไว้เพื่อวัตถุประสงค์ในการเข้าถึงข้อมูลและทางเทคนิคเท่านั้น cTrader Store ไม่ใช่โบรกเกอร์และไม่ได้ให้คำแนะนำการลงทุน คำแนะนำส่วนบุคคล หรือการรับประกันผลการดำเนินงานในอนาคต

เพิ่มเติมจากผู้เขียนคนนี้

อินดิเคเตอร์
Volume
Key Levels
+1
Whale Liquidity & Absorption Profile Track institutional money, analyze order flow, and spot reversal zones with volumet
"RenkoProfit" โลโก้
ยอดนิยม
5.0
(2)
$20
/
$25
อินดิเคเตอร์
AI
Prop
+14
Professional Trading Indicator Transform Your Trading with Intelligent Signal Detection RenkoProfit
"Phoenix Zones" โลโก้
ยอดนิยม
4.6
(3)
$19
/
$38
อินดิเคเตอร์
AI
Prop
+9
Phoenix Zones - Detector de Reversiones Críticas
อินดิเคเตอร์
BOS
CHOCH
+5
Smart Money Concepts Automate your institutional analysis and make decisions with pinpoint precision..
อินดิเคเตอร์
AI-assisted
Predictive Monte Carlo Engine Forecast future price paths using institutional-grade statistical models and probability
อินดิเคเตอร์
BOS
VWAP
+4
Gold premiun XAUUSD Exclusive Real-Time Adaptive Intelligence
อินดิเคเตอร์
Liquidity Grab
Liquidity Sweep
+1
CRT Sweep Tracker is an advanced panel for Candle Range Theory (CRT) traders to track HTF sweeps and manage live trades.
อินดิเคเตอร์
Forex
BTCUSD
+11
Catch High-Probability Reversals with Precision Swing
"Candlehtf" โลโก้
เรตติ้งสูง
4.2
(4)
$19
/
$20
อินดิเคเตอร์
SMC
Forex
+13
MultiFrameCandles para cTrader: La Herramienta Definitiva para Dominar Cualquier Marco de Tiempo
อินดิเคเตอร์
Prop
Forex
+10
Heatmap Pro analiza la volatilidad, el volumen y la acción del precio para "pintar" tu gráfico con zonas de color.
อินดิเคเตอร์
MSS
Market Structure
NY HTF Candles is a precision panel designed specifically for institutional traders
"ReversalGuard" โลโก้
เรตติ้งสูง
4.5
(4)
$19
อินดิเคเตอร์
ReversalGuard Pro: Domina el Mercado con Zonas de Soporte y Resistencia de Alta Precisión"

นอกจากนี้คุณยังอาจชอบ

อินดิเคเตอร์
Smart Signal Reversal Trend + Patterns
อินดิเคเตอร์
Forex
Crypto
+2
A powerful cTrader indicator with customizable Moving Average alerts, notifications, and automated trading actions.
"Supertrend" โลโก้
ยอดนิยม
4.3
(3)
$19
อินดิเคเตอร์
ATR
RSI
+6
💹 Define a price channel 📈 and determine trend direction (bullish 🟢 or bearish 🔴).
อินดิเคเตอร์
Forex
Crypto
+2
HTF Candle
อินดิเคเตอร์
Prop
Forex
+15
The best filter for trading trend continuations on Renko charts.
อินดิเคเตอร์
VWAP
Volume
+2
Dynamic VWAP with ±1/±2 Standard Deviation Bands for intraday volatility, extremes and mean reversion.
อินดิเคเตอร์
Support & Resistance
Detects Gartley, Bat, Butterfly, Crab, Shark & Cypher patterns and backtests each one's real win rate.
"ORB v1" โลโก้
ยอดนิยม
5.0
(3)
$19
อินดิเคเตอร์
Breakout
Opening Range Breakout (ORB) - Visual Edition
อินดิเคเตอร์
ATR
Volume
+5
Order blocks with measured hold-rate stats and confidence scoring — not just zones on a chart.
"Candles_Painter" โลโก้
ยอดนิยม
4.6
(3)
$19
อินดิเคเตอร์
Overlay HTF context on any chart: color bars by HTF and draw filled HTF bodies with optional High/Low lines.
"Titan Pro" โลโก้
ยอดนิยม
4.3
(3)
$19
อินดิเคเตอร์
ATR
MACD
+15
Professional trading indicator: 5 cloud types, 9 ML engines, SMC Order Blocks, Pandas-TA & live dashboard.
"Dem" โลโก้
เรตติ้งสูง
4.2
(4)
$20
อินดิเคเตอร์
Forex
BTCUSD
+5
Scalping indicator for Renko 100 using EMAs to show trend and entry zones with clear colored rectangles.
อินดิเคเตอร์
Engulfing
Fibonacci
+4
Six higher-timeframe candle sets on one chart, with liquidity sweep detection and swept levels.
อินดิเคเตอร์
MSS
Key Levels
+2
Fractal based market structure indicator that identifies HH, HL, LH, and LL pivot with confirmed, non-repainting fractal
อินดิเคเตอร์
BOS
CHOCH
+4
Dual-track market structure detection with BVC order flow confirmation and two-stage liquidity sweep validation.
อินดิเคเตอร์
SMC
Forex
+7
Simple Smart Money Concepts (SMC)
อินดิเคเตอร์
BOS
Imbalance
+4
Automatically detects and highlights both Bullish and Bearish Fair Value Gaps (FVGs).
อินดิเคเตอร์
BOS
Key Levels
+1
Guided by Yahuah Yahusha. 15M: BOS above red (buys)/below green (sells). 4HC reject+BOS. 5M: RBS/SBR. SL wick. TP 1:4.

ราคา

28
การขาย
576
ติดตั้งฟรี