
Opis
🏆 Ponad 10 000 traderów ufa naszemu zestawowi 25+ algorytmów! 🏆
Od Struktury Rynku i Płynności do Inteligentnych Systemów Wyjścia i Narzędzi Predykcyjnych - stworzyliśmy KAŻDE narzędzie, którego potrzebujesz do konsekwentnej pracy.
👉 Uzyskaj dostęp do wszystkich 25+ SPRAWDZONYCH systemów:
_______________________________________________
📌 Wskaźniki Struktury Rynku
· ✅ AdvancedMarket Structure: Bos, Choch, SwinLevels, Order Blocks, Market Structure& Liquidity Finder
· 🔄 Dynamiczna analiza struktury rynku punktów zwrotnych
· 🧱 Order Block
· ⚖️ Nierównowaga Rynku
· ⛓️ BOS & CHOCH
· 🧠 ICT Power of 3
_______________________________________________
🔚 Inteligentne Systemy Wyjścia
_______________________________________________
📐 Wskaźniki ZigZag
· 🔍 Projekcja Płynności Ceny ZigZag
· ➖ ZigZag
_______________________________________________
🧱 Wskaźniki Wsparcia i Oporu
· 🟩 SmartTrend Linie Wsparcia i Oporu
· 🧱 Wszystkie Poziomy Wsparcia i Oporu
_______________________________________________
📊 Wskaźniki Trendu i Kanału
· 📊 Supertrend
· 🌈 Dynamiczny Gradient Trendu
_______________________________________________
💧 Narzędzia Wolumenu i Płynności
_______________________________________________
⚡ Wskaźniki Momentum i RSI
· 🔎 Multi-Level Candle Bias
Tracker
_______________________________________________
🔮 Narzędzia Predykcji i Projekcji
· 📐 Predykcja oparta na Linreg & ATR
· 📏 Fibonacci Linear Regression Wieloczasowa
· 📈 Projektor Przepływu Rynku Napędzanego Wolumenem_________________________
_________________________________________________________________________________________________
_________________________________________________________________________________________________
ZigZag Structure Pro – 🚀
Automatycznie identyfikuje istotne punkty zwrotne rynku (kluczowe maksima i minima) oraz rysuje dynamiczne strefy wsparcia i oporu aktualizujące się w czasie rzeczywistym. 🎯 W przeciwieństwie do tradycyjnych statycznych poziomów, ten wskaźnik nieustannie dostosowuje się do zmieniającej się struktury cenowej.
Do czego służy? ❓
Ten wskaźnik to profesjonalne narzędzie analizy technicznej zaprojektowane do:
- Identyfikacji poziomów instytucjonalnych: 🏛️ Automatycznie wykrywa punkty, w których cena utworzyła ważne struktury wysokich i niskich poziomów.
- Analizy struktury rynku: 📊 Klasyfikuje każdy ruch zgodnie z metodologią struktury byczej/niedźwiedziej (Higher Highs, Lower Lows itp.).
- Projekcji trendu: 🔮 Przedłuża linie trendu w przyszłość, aby przewidzieć potencjalne strefy reakcji cenowej.
- Handlu odwróceniami i kontynuacjami: 💰 Oznaczone poziomy służą jako odniesienie dla wejść, stop-lossów i celów zysku.
Wskaźnik rysuje na Twoim wykresie: ✍️
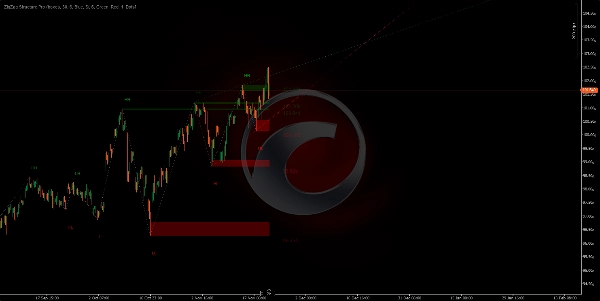
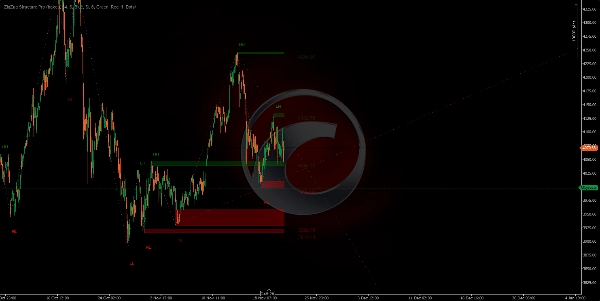
1. Strefy wsparcia/oporu (prostokąty)
- Zielone strefy: 🟢 Oznaczają obszary wsparcia (istotne minima, gdzie cena może odbić).
- Czerwone strefy: 🔴 Oznaczają obszary oporu (istotne maksima, gdzie cena może się cofnąć).
- Te strefy są projekcją w przód, pokazując aktualne aktywne poziomy.
- Grubość każdej strefy reprezentuje korpus świecy, na której utworzono pivot.
https://chartshots.spotware.com/c/691f5a4d75ac4
https://chartshots.spotware.com/c/691f6b4f2e98b
https://chartshots.spotware.com/c/691f6c6fda808
https://chartshots.spotware.com/c/691f6d0aa6155
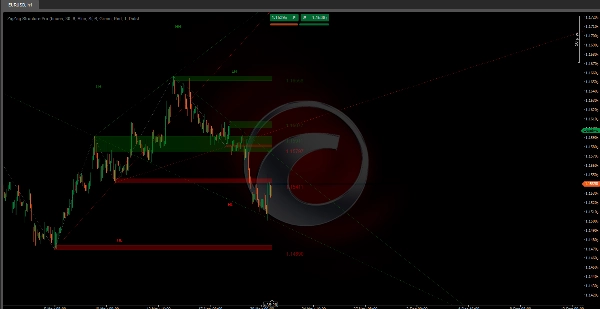
2. Linie łączące ⚡
- Łączą każdy pivot z następnym, tworząc wizualny wzór "zigzag".
- Eliminują szumy rynkowe, pokazując tylko naprawdę istotne ruchy.
- Ułatwiają szybkie zobaczenie kierunku i struktury trendu na pierwszy rzut oka.
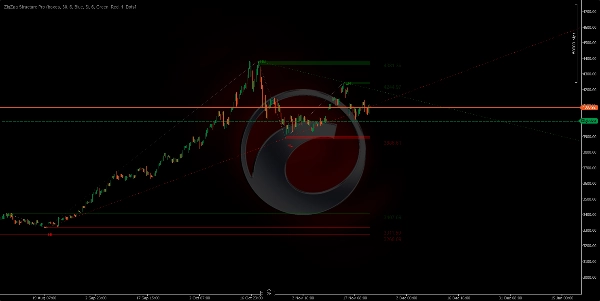
3. Projekcje linii trendu (wydłużone zielone/czerwone)
- Rysowane od poprzedniego pivot do aktualnego i wydłużone w przyszłość.
- Zielone: 🟢 Linie trendu wzrostowego (od minimów).
- Czerwone: 🔴 Linie trendu spadkowego (od maksimów).
- Pokazuje 2 najnowsze i aktywne linie trendu.
- Przydatne do wykrywania wybić lub respektów trendu.
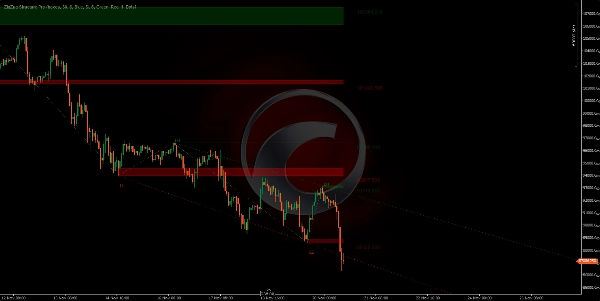
4. Etykiety struktury rynku 🏷️
Każdy pivot pokazuje etykietę wskazującą jego klasyfikację:
- HH (Higher High): ↗️ Wyższe maksimum - kontynuacja wzrostowa.
- LH (Lower High): ⬆️ Niższe maksimum - możliwe odwrócenie spadkowe.
- HL (Higher Low): ⬇️ Wyższe minimum - możliwe odwrócenie wzrostowe.
- LL (Lower Low): ↘️ Niższe minimum - kontynuacja spadkowa.
Logika algorytmu 🧠
Wskaźnik wykorzystuje adaptacyjny algorytm zigzag, który:
- Skanuje cenę w poszukiwaniu maksimów i minimów w konfigurowalnym okresie (domyślnie 34 świece).
- Filtruje nieistotne ruchy przez minimalny próg odchylenia (domyślnie 6 pipsów).
- Weryfikuje każdy pivot zapewniając, że reprezentuje rzeczywistą zmianę struktury rynku.
- Porównuje struktury między kolejnymi pivotami, aby sklasyfikować typ ruchu.
- Dynamicznie aktualizuje strefy w miarę pojawiania się nowych pivotów, usuwając najstarsze.
Główne ustawienia ⚙️
- Liczba świec do analizy pivotów: Kontroluje czułość detektora pivotów (mniejsza = więcej pivotów, większa = tylko główne pivoty).
- Filtr odchylenia ceny: Filtr szumów - ruchy mniejsze niż ta wartość są ignorowane.
- Maksymalna liczba widocznych stref: Liczba historycznych poziomów pozostających widocznymi (od 1 do 20).
- Typ wyświetlania stref: Wybierz między prostokątami (pełne strefy) lub prostymi liniami.
- Pokaż wydłużone linie trendu: Aktywuj/dezaktywuj projekcje trendu.
Szybki przewodnik po parametrach 📖
Liczba świec do analizy pivotów (Domyślnie: 30)
- ↑ Zwiększ (40-100): MNIEJ pivotów, ważniejszych. Do swing tradingu.
- ↓ Zmniejsz (15-25): WIĘCEJ pivotów, więcej sygnałów. Do scalping/day tradingu.
Filtr odchylenia ceny (Domyślnie: 6)
- ↑ Zwiększ (8-15): Filtruje szumy, tylko duże ruchy. Mniej sygnałów, wyższa jakość.
- ↓ Zmniejsz (2-5): Bardziej czuły, wychwytuje małe ruchy. Więcej sygnałów.
Maksymalna liczba widocznych stref (Domyślnie: 6)
- ↑ Zwiększ (10-20): Więcej widocznych historycznych poziomów. Do głębokiej analizy.
- ↓ Zmniejsz (2-4): Tylko ostatnie poziomy. Czysty wykres.
Limit historycznych pivotów (Domyślnie: 200)
- ↑ Zwiększ (300-500): Więcej historii do obliczeń. Analiza długoterminowa.
- ↓ Zmniejsz (50-150): Tylko ostatnia struktura. Lepsza wydajność.
Liczba aktywnych projekcji (Domyślnie: 5)
- ↑ Zwiększ (5-10): Więcej projektowanych linii trendu.
- ↓ Zmniejsz (1-2): Tylko dominujące trendy. Większa przejrzystość.
Pokaż wydłużone linie trendu (Tak/Nie)
- Włączone: Projekcje trendów w przyszłość.
- Wyłączone: Tylko historyczny zigzag.
🎯 Szybkie ustawienia
- Scalping: Lookback 15-20 | Odchylenie 3-5 | Strefy 3-4
- Day Trading: Lookback 25-35 | Odchylenie 6-8 | Strefy 5-6
- Swing Trading: Lookback 40-60 | Odchylenie 10-15 | Strefy 8-12
Podsumowanie
Opinie klientów
5 | 0 % | |
4 | 100 % | |
3 | 0 % | |
2 | 0 % | |
1 | 0 % |


