
Simple ICT Concepts
Gösterge
3 satın almalar
Sürüm 1.0, Dec 2025
Windows, Mac
4.0
Değerlendirmeler: 1
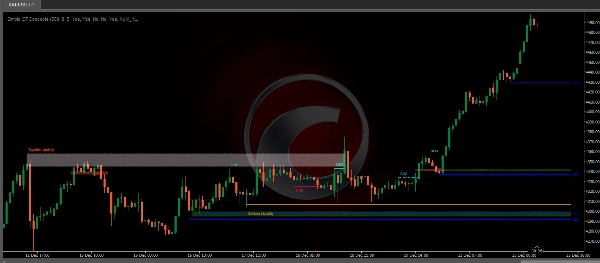
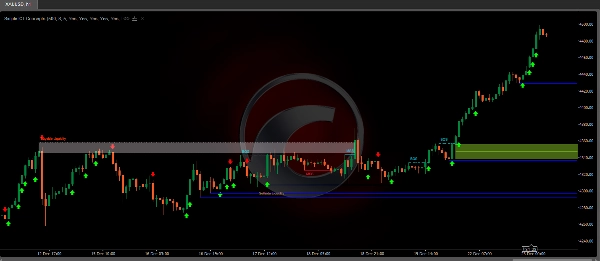
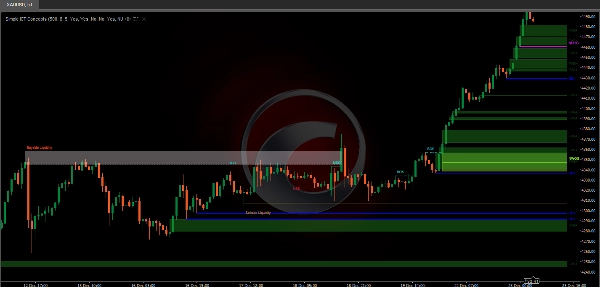
Basit ICT Kavramları Göstergesi, tüccarların İç Çember Tüccarı (ICT) metodolojisinin prensiplerini uygulamalarına yardımcı olmak için tasarlanmış güçlü bir araçtır. Bu gösterge, likidite seviyeleri, destek ve direnç ile piyasa yapısı gibi anahtar bölgeleri tanımlamaya odaklanır ve fiyat hareketi ile akıllı para kavramı tüccarları için paha biçilmez bir varlık haline gelir.
Ana Özellikler
Piyasa Yapısı:
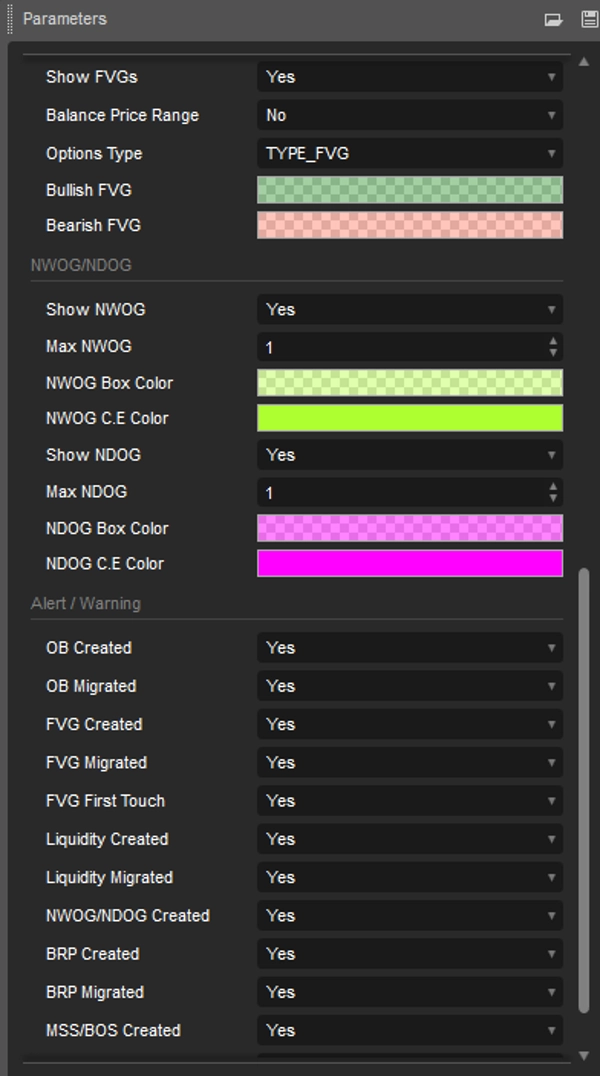
Piyasa yapısı etiketleri, fiyatın önceki bir salınım noktasını kırmasından oluşturulur. Bu, kullanıcının fiyat hareketine dayalı olarak mevcut piyasa trendini belirlemesine olanak tanır.İki tür Piyasa Yapısı etiketi bulunmaktadır:Piyasa Yapısı Kayması (MSS)Yapı Kırılması (BOS)MSS, fiyatın yükseliş trendinde bir salınım dipini veya düşüş trendinde bir salınım zirvesini kırması durumunda meydana gelir ve potansiyel bir dönüşü vurgular.Bu genellikle "CHoCH" olarak etiketlenir, ancak ICT bunu MSS olarak belirtir. Öte yandan, BOS etiketleri fiyatın yükseliş trendinde bir salınım zirvesini veya düşüş trendinde bir salınım dipini kırması durumunda oluşur.Bu özel salınım noktalarının oluşumu, daha düşük zaman dilimlerinde likidite avcılığını vurgulayan geri çekilmeler (tetikleyiciler) nedeniyle gerçekleşir.Ana salınım noktaları: Yüksek Zirveler (HH) ve Düşük Dipler (LL), Yüksek Dipler (HL) ve Düşük Zirveler (LH)Yer Değiştirme:Yer değiştirmeler, fiyatın aynı duyguya (boğa/ayı) sahip ardışık mumlar oluşturduğu, büyük gövdeli ve kısa gölgeli senaryolardır.Bunlar, pozitif otomatik korelasyon (açılıştan kapanışa değişimin aynı işaretli bir değişimle takip edilme olasılığı daha yüksektir) ve volatilite kümelenmesi (büyük değişikliklerin büyük değişiklikleri takip etmesi) ile daha teknik olarak tanımlanabilir.Yer değiştirmeler, dengesizliklerin ve piyasa yapısının oluşumuna neden olabilir; bunlar bir meta emrin tam olarak gerçekleştirilmesinden kaynaklanabilir.Hacim Dengesizliği:Bir Hacim Dengesizliği (V.I.), mum gövdesi olmayan bir fiyat alanı olduğunda meydana gelir. Fitillerin üst üste binmesinde yukarı-aşağı hareket vardır, ancak hacmin büyük kısmı mumun gövdesinde olduğu için buna Hacim Dengesizliği denir.Emir Blokları:Bir ICT (İç Çember Tüccarı) emir bloğu, büyük kurumsal yatırımcıların önemli alım veya satım emirleri verdiği grafik üzerindeki fiyat alanıdır. Emir blokları, potansiyel destek ve direnç seviyelerini belirlemeye ve fiyat dönüşlerini tahmin etmeye yardımcı olabileceği için ticarette önemli bir kavramdır.Likidite:Alım tarafı/Satım tarafı likidite seviyeleri, piyasa katılımcılarının limit/durdurma emirleri verebileceği fiyat seviyelerini vurgular.Alım tarafı likidite seviyeleri, kısa pozisyonlardaki stop-loss emirlerini ve uzun pozisyonlardaki limit emirlerini bir araya getirirken, Satım tarafı likidite seviyeleri uzun pozisyonlardaki stop-loss emirlerini ve kısa pozisyonlardaki limit emirlerini bir araya getirir.Bu seviyeler farklı roller oynayabilir. Daha bilgili piyasa katılımcıları bu seviyeleri likidite kaynağı olarak görebilir ve belirli bir seviyedeki likidite azaldığında başka bir alanda bulunacaktır.FVG/IFVG:Adil Değer Boşlukları: Orta mumun yanındaki mum gölgelerinin üst üste binmediği üç mumluk bir oluşumdur, bu boşluk alanını vurgular.İma Edilen Adil Değer Boşlukları: Adil değer boşluğunun aksine, ima edilen adil değer boşluğunda orta mumun yanındaki mum gölgeleri üst üste biner. Boşluk alanı, ilgili gölge ile mum gövdesinin en yakın uç noktası arasındaki ortalamadan oluşturulur.Dengeli Fiyat Aralığı: Dengeli fiyat aralıkları, bir adil değer boşluğunun önceki bir adil değer boşluğuyla üst üste binmesi durumunda oluşur ve üst üste binen alan dengesizlik alanını oluşturur.NWOG/NDOG:Bu gösterge, yeni hafta açılış boşluklarını (NWOG) ve yeni gün açılış boşluklarını (NDOG) ortaya çıkarır. NWOG, Cuma kapanış fiyatı ile Pazar açılış fiyatı arasındaki boşluktur. NDOG ise önceki günün açılış ve kapanış fiyatı arasındaki boşluktur.
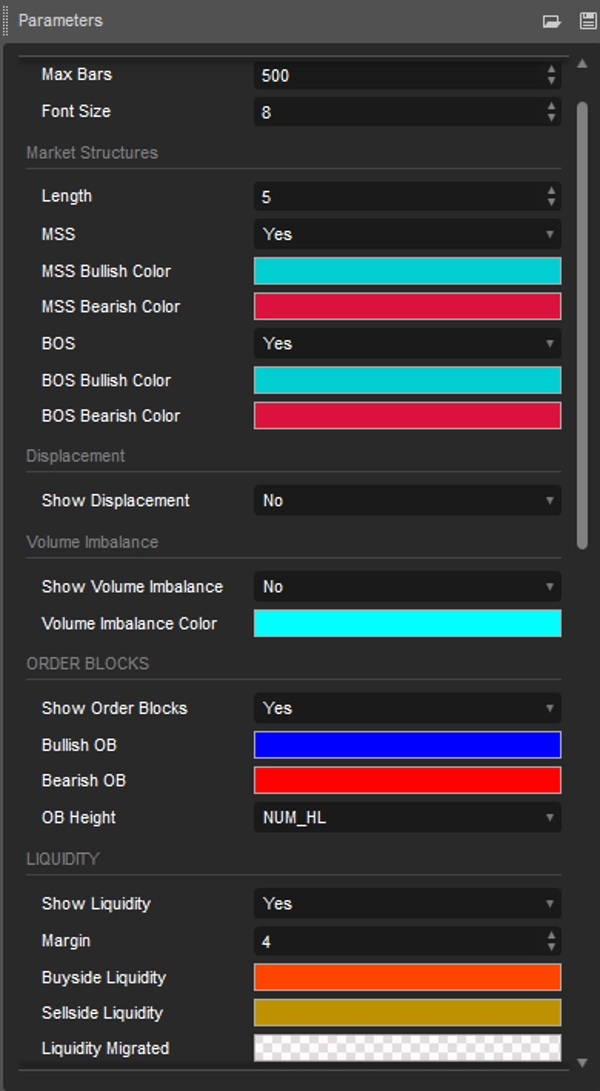
Özelleştirilebilir Özellikler
Kullanıcılar, veri uzunluğu, renkler ve görüntüleme stilleri gibi ayarları ticaret tercihlerine göre ayarlayabilirler.
Tüccarlar İçin Faydalar
Manuel analizde zaman kazandırır, ticaret verimliliğini artırır.
Dalgalı piyasa koşullarında hızlı ve bilinçli kararlar alınmasına yardımcı olur.
Hem yeni başlayanlar hem de deneyimli tüccarlar için kullanımı kolaydır.
Sonuç
Basit ICT Kavramları Göstergesi, sadece bir araç değil, ICT stratejilerini etkili bir şekilde uygulamak isteyen tüccarlar için kapsamlı bir çözümdür. Piyasa analizini geliştirmek ve hassas işlemler gerçekleştirmek için sağlam bir tercihtir.
Gösterge profili
4.0
Değerlendirmeler: 1
5 | 0 % | |
4 | 100 % | |
3 | 0 % | |
2 | 0 % | |
1 | 0 % |
Müşteri değerlendirmeleri
December 27, 2025
The signal still needs a chart check, no surprise there. One green trade proves nothing.
BTCUSD
Forex
Signal
Fair Value Gap
Crypto
XAUUSD
NAS100
cTrader Store üzerinden erişilebilen işlem botları, göstergeler ve eklentiler gibi ürünler, üçüncü taraf sağlayıcılar tarafından sağlanır ve yalnızca bilgilendirme ve teknik erişim amaçlarıyla sunulur. cTrader Store bir broker değildir ve yatırım tavsiyesi, kişisel öneriler vermez veya gelecekteki performansı garanti etmez.


!["Gaussian Channel [Iridio Capital]" logosu](https://cdn.ctrader.com/image/webp/7c039209-5573-4a54-a072-f9528b503103_41960)


!["[CB] Pivot Points Pro" logosu](https://cdn.ctrader.com/image/webp/43463c82-67b0-4f10-a4ba-901bba091d81_32594)


34
Satışlar
2.15K
Ücretsiz yüklemeler