الوصف
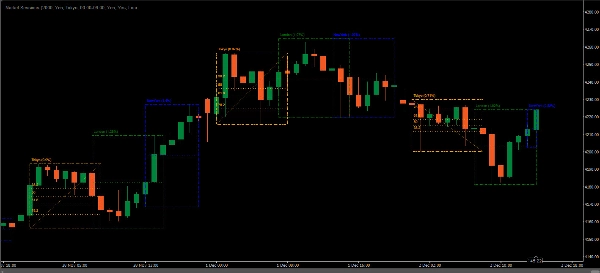
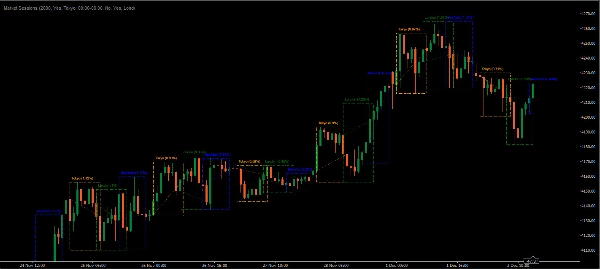
مؤشر جلسات السوق هو أداة شائعة بين متداولي الفوركس والأسهم لتمثيل الجلسات التداولية العالمية بصريًا على مخطط السعر. يبرز فترات الوقت للجلسات التداولية الرئيسية — مثل الآسيوية (طوكيو), الأوروبية (لندن)، و الأمريكية (نيويورك) مباشرة على المخطط. يساعد هذا المتداولين على تحديد أوقات فتح وإغلاق الأسواق، مما يسمح باتخاذ قرارات أفضل بناءً على سلوك التداول الخاص بكل جلسة.
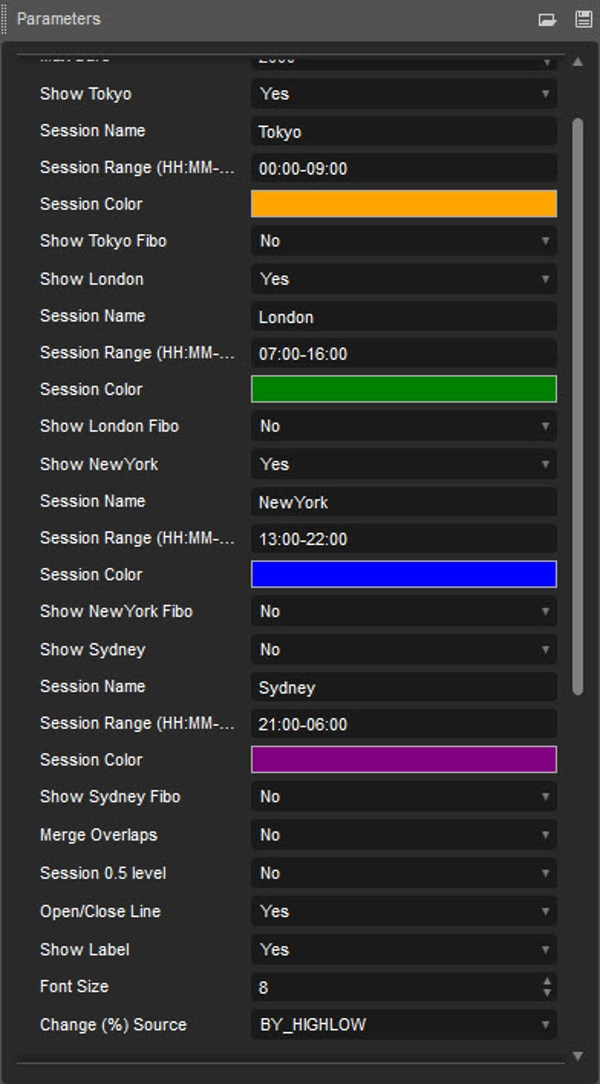
- الجلسة الآسيوية (الافتراضي: 00:00-09:00)
- جلسة لندن (الافتراضي: 07:00-16:00)
- جلسة نيويورك (الافتراضي: 13:00-22:00)
- جلسة سيدني (الافتراضي: 21:00-06:00)
الميزات الرئيسية لمؤشر جلسات السوق
- توقيت الجلسات والتداخلات:
-
- يشير المؤشر إلى أوقات بدء وانتهاء كل جلسة. هذه الميزة مفيدة لأن لكل جلسة خصائص فريدة — على سبيل المثال، الجلسة الآسيوية عادة ما تكون أكثر هدوءًا، بينما جلسة لندن غالبًا ما تشهد تقلبات عالية. كما يتم تمييز التداخلات، مثل تداخل لندن-نيويورك، مما يشير إلى أوقات نشاط متزايد.
- ألوان الجلسات القابلة للتخصيص:
-
- يمكن للمتداولين غالبًا تخصيص ألوان كل جلسة، مما يسهل التمييز البصري بينها. تضيف هذه التخصيصات وضوحًا وتساعد المتداولين على التركيز على الجلسات التي يفضلونها.
- مناطق زمنية قابلة للتعديل:
-
- نظرًا لأن المتداولين موزعون عالميًا، يسمح المؤشر عادة بتعديل المناطق الزمنية، مما يوافق أوقات بدء وانتهاء الجلسات مع الوقت المحلي للمتداول، وهو أمر مفيد بشكل خاص لأولئك الذين يتواجدون في مناطق زمنية مختلفة عن مراكز التداول الرئيسية.
- استراتيجيات خاصة بكل جلسة:
-
- لكل جلسة خصائص مميزة. على سبيل المثال، جلسة لندن غالبًا ما تكون الأكثر تقلبًا، مما يوفر فرصًا للاختراق، بينما الجلسة الآسيوية تميل إلى أن تكون أكثر هدوءًا، مما يناسب استراتيجيات التداول ضمن نطاق. فهم هذه الفروق يسمح للمتداولين بتكييف استراتيجياتهم بناءً على اتجاهات كل جلسة.
لماذا تستخدم مؤشر جلسات السوق؟
- توقيت أفضل للصفقات:
-
- من خلال معرفة الجلسة النشطة، يمكن للمتداولين تعديل استراتيجياتهم للاستفادة من مستويات مختلفة من التقلب والسيولة.
- تحليل أفضل وتطوير استراتيجيات:
-
- مع تمييز أوقات الجلسات بصريًا، يمكن للمتداولين تحليل سلوك السعر عبر الجلسات لتطوير وتحسين الاستراتيجيات التي تناسب خصائص كل جلسة.
- زيادة الوعي بتقلبات السوق:
-
- غالبًا ما ترتفع التقلبات خلال افتتاح وإغلاق الجلسات والتداخلات. يساعد المؤشر في توقع هذه التحركات، مما يقلل من احتمال التعرض لمفاجآت بسبب تغيرات السوق المفاجئة.
مثال على حالة استخدام
قد يستهدف متداول مهتم بالتقلبات فترة تداخل لندن-نيويورك للاستفادة من حركة السوق الأعلى. باستخدام مؤشر جلسات السوق، يمكنه تخطيط الصفقات لتتزامن مع هذا التداخل، مما يزيد من فرص التقاط حركة سعرية مهمة.
باختصار، مؤشر جلسات السوق ضروري للمتداولين الذين يرغبون في اتخاذ قرارات مستنيرة بناءً على سلوكيات السوق المرتبطة بالوقت. يوفر وضوحًا، يعزز التحليل، ويمكن أن يدعم استراتيجيات تداول أكثر فعالية.
الملخص
تقييمات العملاء
5 | 33 % | |
4 | 67 % | |
3 | 0 % | |
2 | 0 % | |
1 | 0 % |