Описание
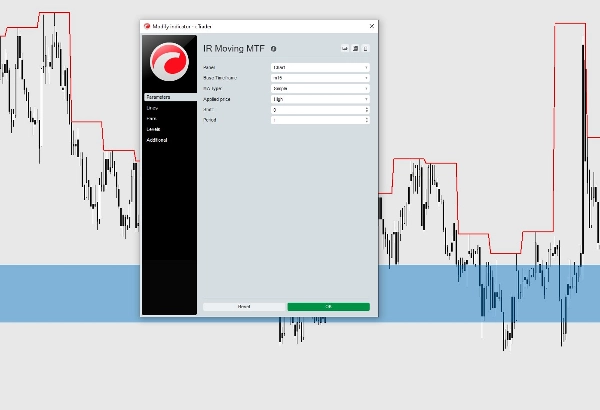
Мульти таймфрейм скользящая средняя — это мощный и гибкий индикатор для cTrader, который позволяет отображать скользящую среднюю, рассчитанную с любого таймфрейма, непосредственно на вашем текущем графике.
В отличие от стандартного индикатора скользящей средней, эта версия предоставляет расширенные возможности настройки, что делает её подходящей для трейдеров, использующих анализ на нескольких таймфреймах в своих торговых стратегиях.
Особенности
- Отображение скользящей средней с любого таймфрейма на текущем графике.
- Поддержка нескольких методов скользящей средней:
-
- Простая (SMA)
- Экспоненциальная (EMA)
- Сглаженная (SMMA)
- Линейно-взвешенная (LWMA)
- Вайлдера
- Выбор различных источников цены:
-
- Закрытие
- Открытие
- Максимум
- Минимум
- Медианная цена
- Типичная цена
- Взвешенная цена
- Регулируемый период скользящей средней.
- Сдвиг (Offset) скользящей средней вперёд или назад.
- Полностью настраиваемые цвета, толщина и стиль линии.
- Точный расчёт на нескольких таймфреймах с плавной визуализацией.
- Работает со всеми символами и на всех таймфреймах.
Идеально подходит для
Этот индикатор особенно полезен для трейдеров, которые:
- Торгуют, используя анализ на нескольких таймфреймах.
- Используют тренды на более высоких таймфреймах для подтверждения входа.
- Хотят отслеживать динамические уровни поддержки и сопротивления.
- Комбинируют скользящие средние со стратегиями Price Action.
Будь вы скальпером, дейтрейдером или свинг-трейдером, этот индикатор помогает визуализировать направление рынка на более высоких таймфреймах без переключения между графиками.
Чтобы поддержать нас для получения большего количества бесплатных индикаторов, пожалуйста, используйте ссылку ниже и зарегистрируйтесь у брокера
🇮🇷 توضیحات فارسی
مووینگ اوریج مولتی تایمفریم
اندیکاتور Multi Time Frame Moving Average یک ابزار حرفهای برای cTrader است که به شما امکان میدهد مووینگ اوریج هر تایمفریمی را مستقیماً روی چارت فعلی نمایش دهید.
برخلاف مووینگ اوریج پیشفرض سیتریدر، این اندیکاتور امکانات بیشتری برای شخصیسازی در اختیار شما قرار میدهد و برای معاملهگرانی که از تحلیل چند تایمفریمی استفاده میکنند بسیار کاربردی است.
امکانات
- نمایش مووینگ اوریج هر تایمفریم روی چارت فعلی
- پشتیبانی از انواع مووینگ اوریج:
-
- SMA
- EMA
- SMMA
- LWMA
- Wilder's Moving Average
- انتخاب نوع قیمت محاسبه:
-
- Close
- Open
- High
- Low
- Median Price
- Typical Price
- Weighted Price
- قابلیت تنظیم دوره (Period)
- امکان جابهجایی (Shift/Offset) مووینگ اوریج به جلو یا عقب
- تنظیم کامل رنگ، ضخامت و استایل خط
- محاسبات دقیق در حالت Multi Time Frame
- قابل استفاده روی تمام نمادها و تمام تایمفریمها
مناسب برای
این اندیکاتور برای معاملهگرانی مناسب است که:
- از تحلیل چند تایمفریمی استفاده میکنند.
- روند تایمفریمهای بالاتر را برای تأیید ورود بررسی میکنند.
- از مووینگ اوریج بهعنوان حمایت و مقاومت داینامیک استفاده میکنند.
- استراتژی معاملاتی آنها بر پایه Price Action و Moving Average است.
این ابزار به شما کمک میکند بدون نیاز به جابهجایی بین تایمفریمها، روند تایمفریمهای بالاتر را مستقیماً روی نمودار فعلی مشاهده کنید.