
الوصف
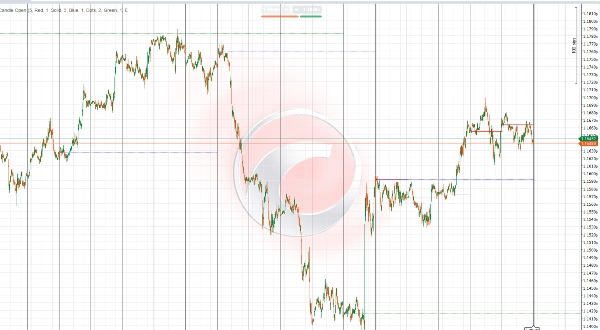
مؤشر فتح شمعة IR هو أداة متعددة الاستخدامات وقابلة للتخصيص ترسم أسعار فتح الشموع الأسبوعية واليومية والشهرية على مخطط التداول الخاص بك. يمكن للمتداولين اختيار عدد الفترات (أيام، أسابيع، أشهر) للعرض، مما يتيح تحليل متعدد الأطر الزمنية مرن يتناسب مع استراتيجيتهم.
تشمل الميزات الرئيسية:
- رسم دقيق لفتح الشموع لعدد الفترات اليومية والأسبوعية والشهرية التي يحددها المستخدم.
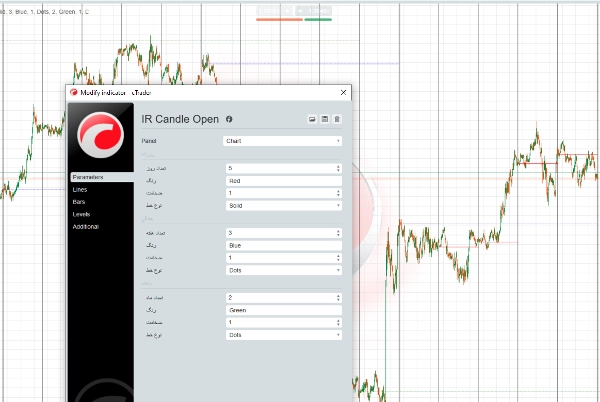
- أنماط خطوط قابلة للتخصيص: يمكن للمستخدمين اختيار نوع الخط (صلب، متقطع، منقط)، اللون، والسماكة لتحسين وضوح المخطط.
- يدعم التصور متعدد الأطر الزمنية للمساعدة في تحديد مستويات الأسعار المهمة عبر أفق زمني مختلف.
- يساعد في اكتشاف مناطق الدعم والمقاومة المحتملة بناءً على هذه الأسعار المفتوحة الحرجة.
- متوافق مع أسواق مختلفة مثل الفوركس، السلع، المؤشرات، والعملات المشفرة.
تمكن هذه المرونة المتداولين من تعديل عرض المؤشر وفقًا لتفضيلاتهم الشخصية وأسلوب تداولهم، مما يعزز الوضوح ويحسن اتخاذ القرار بناءً على مستويات الأسعار الحاسمة.
توضیح فارسی (بهروز شده)
اندیکاتور IR Candle Open ابزاری منعطف و قابل تنظیم است که قیمتهای باز شدن کندلهای هفتگی، روزانه و ماهیانه را روی نمودار معاملاتی شما نمایش میدهد. کاربران میتوانند تعداد دورههای روزانه، هفتگی و ماهیانه که میخواهند خطوط آنها نمایش داده شود را انتخاب کنند تا تحلیل چندتایمفریمی متناسب با سبک معاملاتی خود داشته باشند.
ویژگیهای کلیدی:
- نمایش دقیق خطوط قیمت باز شدن کندلها برای تعداد دورههای دلخواه در تایمفریمهای روزانه، هفتگی و ماهیانه.
- امکان انتخاب نوع خط (ساده، خطچین، نقطهچین)، رنگ و ضخامت خطوط برای بهبود وضوح و خوانایی نمودار.
- پشتیبانی از تحلیل چندتایمفریمی جهت شناسایی سطوح مهم قیمتی در بازههای زمانی مختلف.
- کمک به تشخیص سطوح حمایت و مقاومت احتمالی بر اساس این نقاط کلیدی باز شدن قیمتها.
- مناسب برای استفاده در بازارهای مختلف مانند فارکس، کالاها، شاخصها و رمزارزها.
این قابلیتها به تریدرها امکان میدهد تا نمایش اندیکاتور را بر اساس سلیقه و سبک معاملاتی خود تنظیم کنند و با وضوح بیشتر، تصمیمات بهتری بگیرند.
الملخص
تقييمات العملاء
5 | 100 % | |
4 | 0 % | |
3 | 0 % | |
2 | 0 % | |
1 | 0 % |


![شعار "[Stellar Strategies] Visual Trend Momentum"](https://cdn.ctrader.com/image/webp/48aee0a5-f10e-4bc8-9671-78e156fcc5df_27548)


