
الوصف
متوسط فيبوناتشي اليومي - مستويات فيبوناتشي اليومية التلقائية
يعرض النطاق اليومي المتوسط بمستويات فيبوناتشي من افتتاح اليوم
ماذا يفعل هذا المؤشر؟
يقوم مؤشر متوسط فيبوناتشي اليومي برسم مستويات فيبوناتشي تلقائيًا بناءً على النطاق اليومي المتوسط. كل يوم، يعرض المؤشر مستويات رئيسية صاعدة وهابطة من سعر الافتتاح، مما يساعدك على تحديد الأهداف المحتملة ومناطق الانعكاس.
الميزات الرئيسية
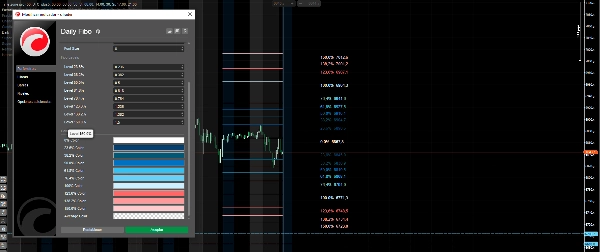
✅ تحديث يومي تلقائي - يتم إعادة رسم المستويات تلقائيًا كل يوم ✅ مستويات قابلة للتخصيص - قم بتكوين ما يصل إلى 8 مستويات فيبوناتشي مختلفة ✅ ألوان مخصصة - لكل مستوى لونه الخاص المميز ✅ تسميات مع الأسعار - يعرض كل من النسبة المئوية والسعر الدقيق لكل مستوى ✅ متوسط يومي قابل للتعديل - اختر عدد الأيام المستخدمة لحساب المتوسط (الافتراضي 20)
المستويات الافتراضية المضمنة
- 0% - افتتاح اليوم (الخط الأساسي)
- 23.6%, 38.2%, 50%, 61.8%, 76.4% - التصحيحات والتمديدات الداخلية
- 100% - النطاق المتوسط الكامل
- 123.6%, 138.2%, 150% - التمديدات الخارجية
كيفية استخدام المؤشر
- تحديد الاتجاه - سعر الافتتاح (0%) هو نقطة المرجع الخاصة بك
- البحث عن أهداف صاعدة - المستويات العليا تحدد أهداف الشراء
- البحث عن أهداف هابطة - المستويات السفلى تحدد أهداف البيع
- مناطق الانعكاس - عندما يصل السعر إلى مستويات قصوى (100%+)، ابحث عن انعكاسات محتملة
المعلمات القابلة للتعديل
- أيام حساب المتوسط
- مستويات فيبوناتشي مخصصة
- ألوان فردية لكل مستوى
- إظهار/إخفاء التسميات والأسعار
- حجم الخط
مثالي للمتداولين الذين يبحثون عن أهداف واضحة ومناطق سعرية محتملة خلال جلسة التداول.
الملخص
تقييمات العملاء
5 | 50 % | |
4 | 50 % | |
3 | 0 % | |
2 | 0 % | |
1 | 0 % |


