الوصف
BB20 Multicolor
مؤشر قوي لتحديد دورة السوق يتم وضعه مباشرة على الرسم البياني الخاص بك، يرمز حركة السعر بألوان عبر 8 حالات سوقية مميزة — من هبوط عميق إلى صعود كامل — باستخدام العلاقة بين السعر وأربعة متوسطات متحركة رئيسية (MM20, MM50, MM100, MM200) معاً مع نطاقات بولينجر.
──────────────────────────
كيف يعمل
──────────────────────────
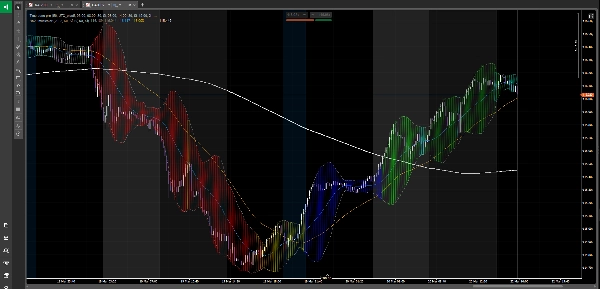
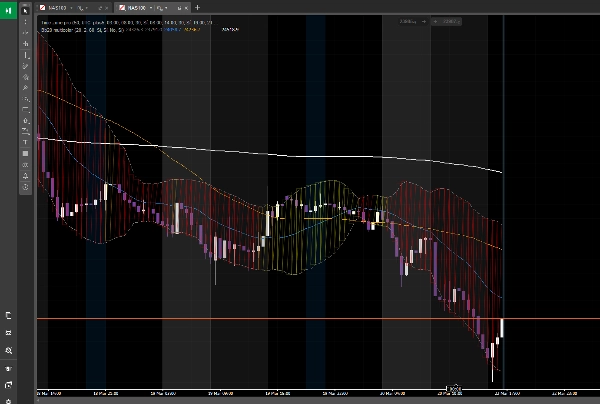
يقوم المؤشر بتقييم موقع السعر باستمرار بالنسبة للمتوسطات المتحركة الأربعة ويُعيّن أحد 8 ألوان لمنطقة سحابة نطاق بولينجر، مما يمنحك قراءة بصرية فورية لمرحلة دورة السوق الحالية:
🔴 أحمر — اتجاه هبوطي واضح
السعر تحت MM200. السوق يهيمن عليه البائعون. التحيز: البيع فقط.
🟠 برتقالي — ارتداد تقني
السعر تحت MM200 لكنه تعافى فوق MM20. ارتداد ضمن اتجاه هبوطي — ليس انقلاباً. منطقة فخ الثيران الشائعة.
🟡 أصفر — المرحلة 1 من الدورة
السعر تجاوز MM50 لكن المتوسطات المتحركة لا تزال هبوطية. أولى علامات التعافي، لم تؤكد بعد.
🔵 أزرق — محاولة انقلاب الاتجاه
MM100 و MM50 تحت MM200، لكن السعر بدأ بالصعود بينهما. منطقة انتقال عالية التقلب — راقب عن كثب.
⬜ رمادي — محايد / ضعف
السعر فوق MM200 لكن تحت MM100. الهيكل طويل الأمد لا يزال صعودياً لكن الزخم يتلاشى. منطقة حذر.
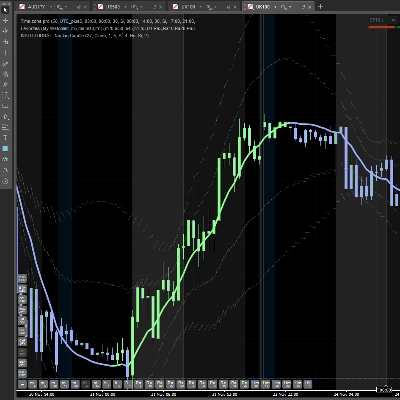
🟢 أخضر ليموني — المرحلة 2 من الدورة
السعر و MM50 فوق MM200. يتم تأكيد دورة صعودية جديدة. يبدأ العديد من المتداولين المؤسسيين بالتموضع هنا.
🪵 أزرق مخضر — تجميع صحي
السعر فوق MM200 و MM100 لكنه يتراجع نحو MM50 أو MM20. توقف طبيعي ضمن اتجاه صعودي — منطقة دخول محتملة مجدداً.
🌲 أخضر داكن — دورة صعودية ناضجة
جميع المتوسطات المتحركة مصطفة بالكامل: MM200 < MM50 < MM20 < السعر. أنقى بيئة اتجاهية. أقل مقاومة للصعود.
──────────────────────────
الميزات
──────────────────────────
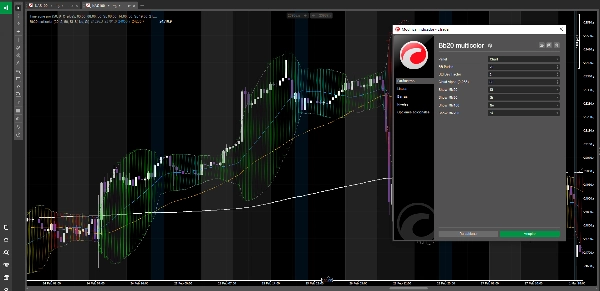
• مناطق السحابة مرسومة أصلياً باستخدام Chart.DrawTriangle في cTrader لتعبئة ناعمة واحترافية المظهر
• عرض نطاقات بولينجر (العليا والسفلى) جنباً إلى جنب مع السحابة
• يمكن تبديل كل من المتوسطات المتحركة الأربعة بشكل فردي (MM20, MM50, MM100, MM200)
• فترة BB، عامل الانحراف المعياري، وشفافية السحابة قابلة للتكوين
• يعمل على أي أداة وأي إطار زمني
• مفتوح المصدر بالكامل — مجاني إلى الأبد
──────────────────────────
كيفية الاستخدام
──────────────────────────
1. استخدم اللون كمرشح لسياق السوق قبل اتخاذ أي صفقة
2. ابحث عن الصفقات الطويلة فقط عندما يكون الخلفية خضراء (ليموني أو داكن)
3. ابحث عن الصفقات القصيرة فقط عندما يكون الخلفية حمراء أو برتقالية
4. استخدم الأصفر، الأزرق، والرمادي كمناطق انتقال — قلل الحجم أو انتظر التأكيد
5. الأزرق المخضر هو منطقة إعادة الدخول في اتجاه صعودي مثبت
متوافق مع أي استراتيجية تداول. فعال بشكل خاص عند دمجه مع حركة السعر، تحليل الحجم، أو الأساليب القائمة على المعنويات.
قم بتثبيته، اسقطه على الرسم البياني الخاص بك، واعرف فوراً في أي مرحلة من السوق أنت.
⚠️ إخلاء مسؤولية المخاطر
التداول في الأدوات المالية ينطوي على مخاطر وليس مناسباً للجميع. قم دائماً بإجراء تحليلك الخاص، وأدر مخاطر التداول بحذر، ولا تتداول أبداً بأموال لا يمكنك تحمل خسارتها.
هذا المؤشر هو أداة تحليل فني — وليس نصيحة مالية. استخدمه بحكمة.
الملخص
- Red: Clear bearish trend (price below MM200)
- Orange: Technical bounce within bearish trend
- Yellow: Early recovery signs (price above MM50, but MAs bearish)
- Blue: Trend reversal attempt with high volatility
- Gray: Neutral or weakening momentum (price above MM200 but below MM100)
- Lime Green: Confirmed new bullish cycle (price and MM50 above MM200)
- Teal: Healthy consolidation in bullish trend (price above MM200 and MM100, pulling back)
- Dark Green: Mature bullish cycle with aligned moving averages
Features include native cloud rendering using cTrader's Chart.DrawTriangle, toggleable moving averages, configurable Bollinger Bands parameters, and compatibility with any instrument and timeframe. The indicator is open source and free to use. It serves as a market context filter to guide trade decisions, recommending long positions in green zones and shorts in red/orange zones, with caution advised in transition colors. It complements various trading strategies, including price action and volume analysis.