
VegaXLR - Auto Support and Resistance
Chỉ báo
5 lượt mua
Phiên bản 1.0, Feb 2025
Windows, Mac
4.3
Đánh giá: 3
Mô tả
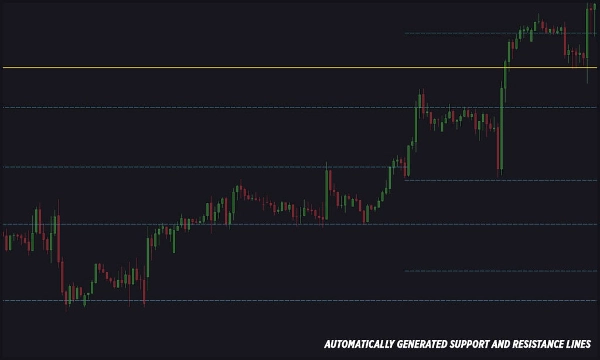
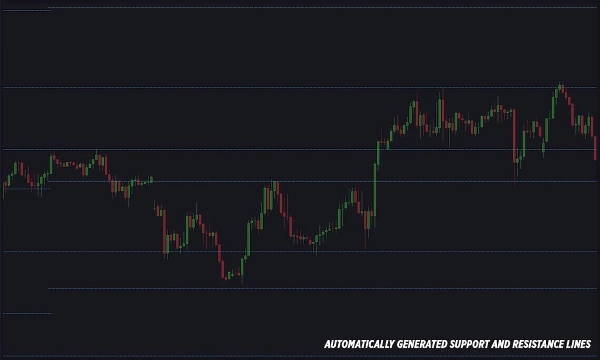
Chỉ báo cTrader này tự động vẽ các đường hỗ trợ và kháng cự trên biểu đồ của bạn, giúp dễ dàng sử dụng cho cả người mới bắt đầu và chuyên gia. Các đường được tạo dựa trên các mức Fibonacci chính và dao động giá (zigzags).
Tính năng:
- Tự động phát hiện và vẽ các đường hỗ trợ và kháng cự.
- Kiểu đường, độ dày và màu sắc hoàn toàn tùy chỉnh.
- Số lượng đường hỗ trợ và kháng cự có thể điều chỉnh.
- Cảnh báo khi giá tương tác với các đường hỗ trợ hoặc kháng cự.
- Nhiều tùy chọn cảnh báo: Telegram, Email, Pop-up và âm thanh.
- Khả năng chọn các mức Fibonacci tạo ra các đường.
- Tùy chọn kích hoạt cảnh báo từ các đường giá Ask hoặc Bid.
- Điều kiện cảnh báo có thể cấu hình: cảnh báo khi đóng nến hoặc cảnh báo chạm giá ngay lập tức.
- Tin nhắn cảnh báo tùy chỉnh với nhận xét do người dùng định nghĩa.
- Tùy chọn chỉ bật cảnh báo cho các mức hỗ trợ và kháng cự mạnh.
- Khả năng chụp và gửi ảnh chụp màn hình biểu đồ qua Telegram (biểu đồ phải hiển thị).
- Thiết lập cảnh báo email đơn giản.
- Truy cập nhanh hướng dẫn sử dụng qua một nút nhỏ trên biểu đồ.
Tóm tắt
Tóm tắt AI
VegaXLR - Auto Support and Resistance is a cTrader indicator that automatically identifies and draws support and resistance lines on trading charts. It uses key Fibonacci levels combined with price swing analysis (zigzags) to generate these lines, aiding traders in recognizing critical price levels. The indicator offers full customization of line styles, thickness, and colors, and allows adjustment of the number of support and resistance lines displayed.
It features real-time alerts triggered when price interacts with these levels, with configurable conditions such as bar-close or instant price-touch alerts. Alert notifications can be sent via multiple channels including Telegram, Email, pop-ups, and sounds. Users can specify which Fibonacci levels to use for line generation and choose whether alerts trigger from Ask or Bid price lines. Additional options include enabling alerts only for strong levels, customizing alert messages, and capturing chart screenshots to send via Telegram.
A user guide is accessible directly from the chart for ease of use. This tool supports Forex markets and is designed to assist both beginners and professionals in technical analysis by automating the detection of key support and resistance zones.
Hồ sơ chỉ báo
Đánh giá của khách hàng
4.3
Đánh giá: 3
5 | 67 % | |
4 | 0 % | |
3 | 33 % | |
2 | 0 % | |
1 | 0 % |
Đánh giá của khách hàng
March 2, 2025
Focused trade layer if the trader wants it keeps attention on levels that actually matter. It works best as support, not a final decision maker. The cleanest use is 3 to 5 levels per chart, with 0.5 pullbacks checked before entry. not every zone holds, even if it looks clean.
March 1, 2025
March 1, 2025
Balanced demo helper for traders who build plans around market levels. It gives value around key price zones, but not every zone holds, even if it looks clean. I would wait for 2 reactions and avoid trades where the target is less than 1.5R. Levels are useful when they reduce noise, not when they crowd the chart.
Thảo luận
Câu hỏi thường gặp
Forex
Các sản phẩm có sẵn trên cTrader Store, bao gồm bot giao dịch, chỉ báo và plugin, được cung cấp bởi các nhà phát triển bên thứ ba và chỉ nhằm mục đích cung cấp thông tin và tiếp cận kỹ thuật. cTrader Store không phải là nhà môi giới và không cung cấp lời khuyên đầu tư, khuyến nghị cá nhân hay bất kỳ đảm bảo nào về hiệu suất trong tương lai.


Giá
215
Lượt bán
680
Cài đặt miễn phí