
Half Trend BT
Indicatore
38 acquisti
Versione 1.0, Mar 2025
Windows, Mac
4.3
Recensioni: 3
Descrizione
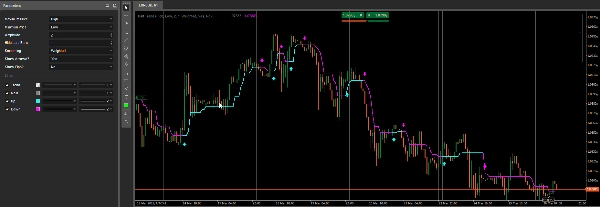
L'indicatore Half Trend è progettato per rilevare e evidenziare potenziali inversioni di tendenza confrontando massimi e minimi recenti su un periodo specificato, quindi tracciando una linea “Up” o “Down” di conseguenza. Opzionalmente disegna frecce ad ogni cambiamento di tendenza e può mostrare le differenze in pip tra i segnali.
- Selezione della Serie High/Low
- L'indicatore utilizza due serie di prezzi (High e Low per impostazione predefinita) per tracciare massimi e minimi locali.
- Puoi selezionare diversi tipi di prezzo (ad esempio,
Open,Close,Median, ecc.) per ogni serie tramite Maximum Price e Minimum Price.
- Medie Mobili e Calcolo del Periodo
- Una media mobile (basata sul tipo di Smoothing scelto e sul periodo di Amplitude) viene applicata sia alla serie di prezzi “high” che a quella “low” selezionata.
- L'indicatore confronta i prezzi della barra corrente con questi livelli high/low smussati per decidere se passare da un trend rialzista a uno ribassista (o viceversa).
- Rilevamento e Tracciamento della Tendenza
- Se l'indicatore identifica un trend rialzista, traccia la linea Up (ciano) e imposta
Trenda+1. - Se rileva un trend ribassista, traccia la linea Down (magenta) e imposta
Trenda-1. - L'output Main (grigio) si aggiorna internamente per riflettere i livelli correnti di supporto/resistenza.
Trendè una serie di output invisibile che memorizza numericamente la direzione della tendenza (+1o-1).
- Se l'indicatore identifica un trend rialzista, traccia la linea Up (ciano) e imposta
- Frecce e Calcolo dei Pip
- Mostrare le Frecce? – Se abilitato, l'indicatore disegna una freccia su ogni nuova barra dove viene rilevata un'inversione di tendenza.
- Mostrare i Pip? – Se abilitato, calcola e mostra la differenza in pip tra l'ultimo segnale e il nuovo segnale, disegnando una piccola etichetta e una linea di tendenza sul grafico.
Riepilogo
Riepilogo AI
The Half Trend BT indicator detects potential trend reversals by analyzing recent highs and lows over a specified period. It compares two selected price series—typically High and Low, but configurable to other price types such as Open, Close, or Median—using moving averages based on chosen smoothing methods and amplitude periods. The indicator plots an "Up" line (cyan) when an uptrend is detected and a "Down" line (magenta) for a downtrend, while internally storing trend direction numerically (+1 or -1). A main output line (gray) reflects current support and resistance levels. Optional features include drawing arrows on bars where trend reversals occur and calculating pip differences between signals, which are displayed as labels and trendlines on the chart. This indicator supports multiple markets including Forex, indices, commodities, cryptocurrencies, and stocks.
Profilo indicatore
Recensioni dei clienti
4.3
Recensioni: 3
5 | 33 % | |
4 | 67 % | |
3 | 0 % | |
2 | 0 % | |
1 | 0 % |
Recensioni dei clienti
March 29, 2025
Clean idea for traders around chart reading. The useful part is adding confirmation before a trade, with the numbers checked before scaling. The cleaner reads should hold across 3 sessions, not just 1 good chart. It is stronger when a 1.5R target is realistic before the entry.
March 28, 2025
March 28, 2025
Decent tool for testing if the trader wants it makes market context easier to scan. It works best as support, not a final decision maker. I would test it on 2 timeframes, 20 signals and a 1R stop plan. it should not be used as a blind entry trigger.
Discussioni
Domande frequenti
Prop
Forex
Signal
Indices
Commodities
Crypto
Stocks
I prodotti disponibili tramite cTrader Store, inclusi bot di trading, indicatori e plugin, sono forniti da sviluppatori terzi e resi disponibili esclusivamente a scopo informativo e di accesso tecnico. cTrader Store non è un broker e non fornisce consulenze in materia di investimento, raccomandazioni individualizzate o garanzie di risultati futuri.


Prezzo
48
Vendite
1.03K
Installazioni gratuite