Descrizione
Camarilla di Bullitt Traders — Visualizza la Struttura. Precisione nel Trading.
Un indicatore pivot Camarilla di livello professionale per cTrader, progettato per rivelare come il prezzo reagisce intorno ai livelli istituzionali.
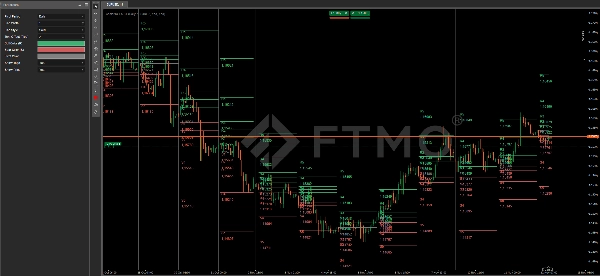
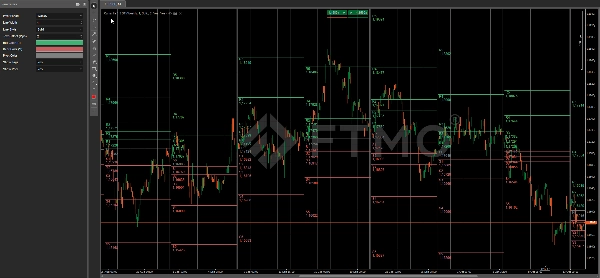
Traccia automaticamente tutti i livelli chiave Camarilla (R1–R5 / S1–S5) e i pivot point su più timeframe — offrendo ai trader una mappa strutturale chiara per inversioni e breakout.
Caratteristiche Principali
- ✅ Vera Formula Camarilla — calcola i livelli dall’alto, basso e chiusura del periodo precedente.
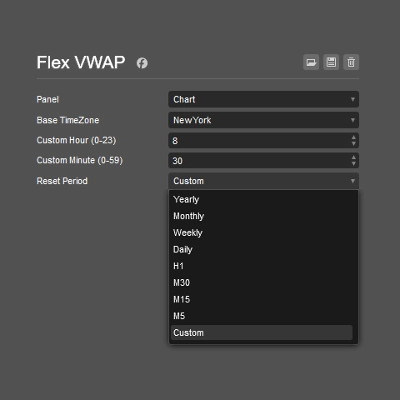
- 📊 Logica Multi-TF — scegli tra periodi pivot Giornalieri, Settimanali o Mensili.
- 🕒 Mappatura Storica — disegna automaticamente i periodi passati per contesto visivo e analisi strutturale.
- 🎨 Stile Personalizzato — regola larghezza, stile e colore della linea per regime (rialzista, ribassista, neutro).
- 💬 Etichette e Prezzi — attiva o disattiva la visualizzazione di testo e valori per un layout pulito o dettagliato.
- ⚡ Leggero e Non-Ripitturante — ottimizzato per velocità e precisione su qualsiasi simbolo.
- 🧩 Funziona su Tutti i Tipi di Grafico — compatibile con time, range, tick e Renko.
Livelli Camarilla
R5 – Zona obiettivo di breakout estremo
R4 – Resistenza principale, potenziale innesco di breakout
R3 – Zona di inversione superiore, spesso usata per entrate short
R2 – Resistenza di livello medio
R1 – Resistenza iniziale, livello di reazione precoce
PP – Punto pivot centrale (zona di mean-reversion)
S1 – Supporto iniziale, livello di reazione precoce
S2 – Supporto di livello medio
S3 – Zona di inversione inferiore, spesso usata per entrate long
S4 – Supporto principale, potenziale innesco di breakout
S5 – Zona obiettivo di breakout estremo
Parametri
Periodo Pivot – scegli Giornaliero, Settimanale o Mensile per il calcolo dei livelli
Larghezza Linea – regola lo spessore complessivo della linea
Stile Linea – imposta Solido, Punti o Tratti
Offset Testo (Pips) – distanza tra linea ed etichetta
Colore Rialzista (R) – colore per i livelli di resistenza (R1–R5)
Colore Ribassista (S) – colore per i livelli di supporto (S1–S5)
Colore Pivot – colore per la linea pivot centrale (PP)
Mostra Etichette – mostra o nascondi i nomi dei livelli R/S
Mostra Prezzo – mostra o nascondi le etichette numeriche dei prezzi
Come Usare
Zone R3–S3 → tipiche aree di inversione intraday
Livelli R4–S4 → conferme di breakout o continuazione
R5–S5 → obiettivi di alta volatilità e zone di esaurimento
Riepilogo
Key features include automatic plotting of historical pivot levels for context, customizable line width, style, and colors for bullish, bearish, and neutral regimes, and options to show or hide level labels and price values. The indicator is lightweight, non-repainting, and compatible with various chart types such as time, range, tick, and Renko charts.
Camarilla levels serve specific roles: R3–S3 zones indicate typical intraday reversal areas; R4–S4 levels suggest breakout or continuation confirmations; and R5–S5 mark extreme breakout targets and high-volatility exhaustion zones. This tool provides a clear structural map to assist traders in identifying potential reversals, breakouts, and target zones across multiple markets including Forex, indices, commodities, cryptocurrencies, and stocks.
Recensioni dei clienti
5 | 100 % | |
4 | 0 % | |
3 | 0 % | |
2 | 0 % | |
1 | 0 % |