
E7 Volume Profile
مؤشر
1.16K التنزيلات
الإصدار 1.0، Feb 2025
Windows, Mac
4.6
التقييمات: 3
الوصف
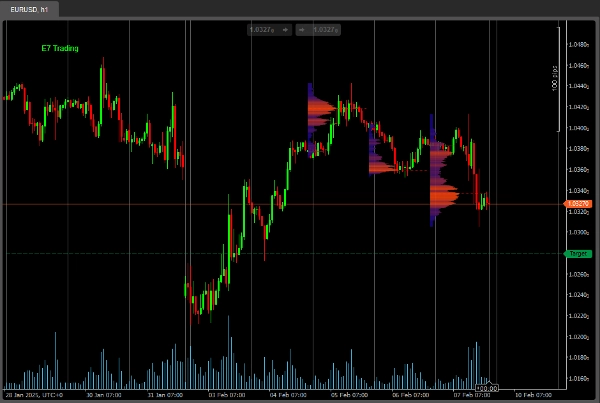
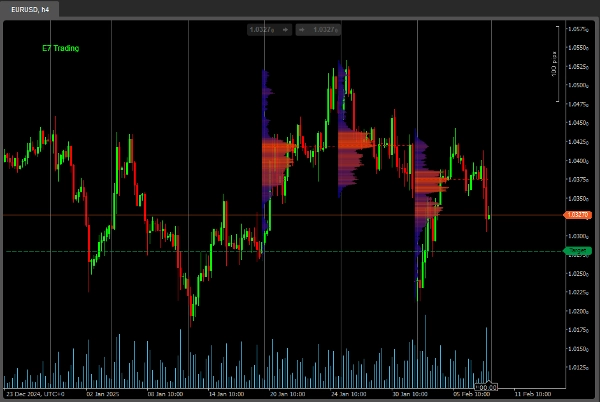
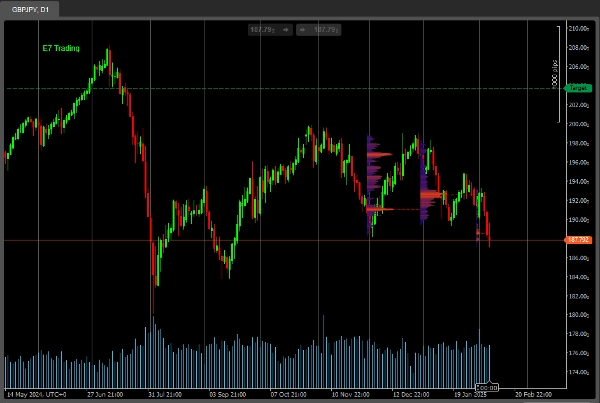
هذا مؤشر بسيط لحجم الملف الشخصي، مخصص لمظهر وإحساس أكثر حداثة.
الإصدار الأساسي محدود بثلاث "فترات نظر" فقط.
الإصدار الكامل قادم قريبًا، ترقبوا هذا المكان.
صيد موفق!
الملخص
ملخص الذكاء الاصطناعي
E7 Volume Profile is a volume profile indicator designed with a modern visual style. It provides traders with volume distribution information over price levels, helping to identify key support and resistance areas. This basic version supports analysis over three distinct lookback periods, allowing users to observe volume patterns within limited historical ranges. The indicator is suitable for use on various timeframes, as illustrated by examples on 1-hour, 4-hour, and daily charts. A full version with expanded features is planned for future release.
ملف تعريف المؤشر
تقييمات العملاء
4.6
التقييمات: 3
5 | 67 % | |
4 | 33 % | |
3 | 0 % | |
2 | 0 % | |
1 | 0 % |
تقييمات العملاء
July 14, 2025
Pros: Clearly visualizes volume distribution with POC, VAH, VAL zones. Customizable and stable across timeframes. Cons: No tooltips or alerts. Lacks template saving and dynamic profile history. Requires confirmation tools for trading signals.
مناقشة
الأسئلة الشائعة
يتم توفير المنتجات المتاحة من خلال cTrader Store، بما في ذلك روبوتات التداول والمؤشرات والإضافات، من قبل مطوري الطرف الثالث وإتاحتها لأغراض الوصول المعلوماتي والفني فقط. cTrader Store ليس وسيطًا ولا يقدم نصائح استثمارية أو توصيات شخصية أو أي ضمان للأداء المستقبلي.
المزيد من هذا المؤلف


السعر
منذ 18/12/2024
2
المبيعات
4.26K
التثبيتات المجانية