
E7 Polynomial Regression Channel
Indikator
889 downloads
Version 1.0, Feb 2025
Windows, Mac
4.8
Bewertungen: 5
Beschreibung
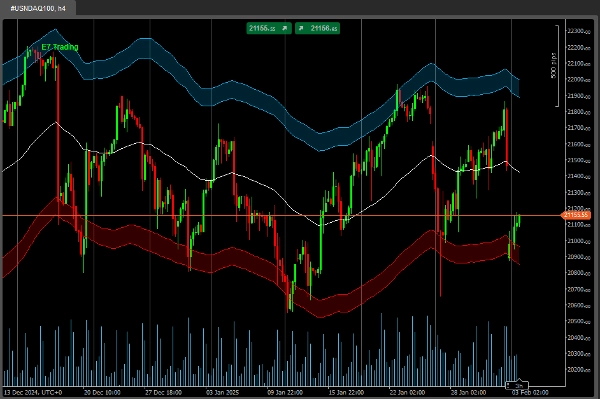
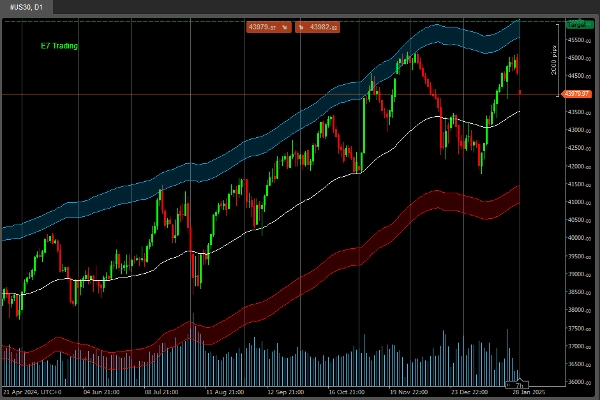
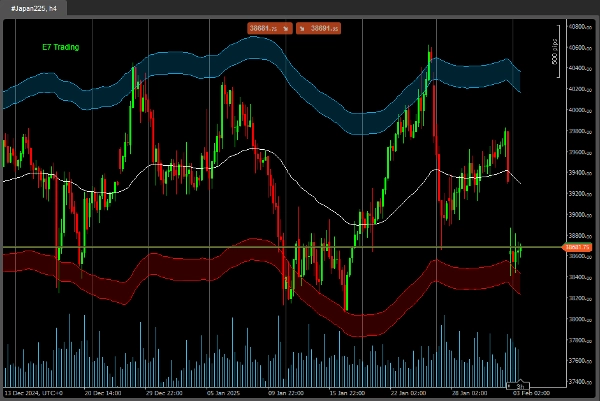
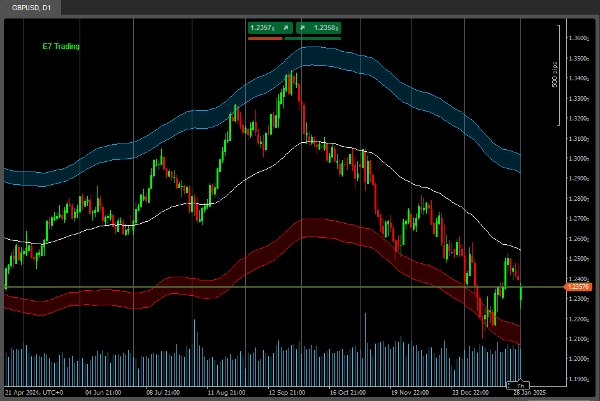
Dies ist ein angepasster Polynomial-Regression-Kanal.
Er spiegelt auch die Volatilität des zugrunde liegenden Vermögenswerts wider.
Dies ermöglicht eine bessere Analyse, wie in den E7-Strategien gelehrt.
Viel Erfolg bei der Suche!
Zusammenfassung
KI-Zusammenfassung
The E7 Polynomial Regression Channel is a customized technical indicator designed for market analysis. It applies polynomial regression to price data, creating a channel that adapts to the underlying asset's price movements. This channel also incorporates volatility measures, allowing users to assess market conditions more comprehensively. By reflecting both trend and volatility, it supports enhanced analysis consistent with the methodologies taught in the E7 Strategies. The indicator is intended for use in trading platforms to assist traders in identifying potential price channels and volatility shifts.
Indikatorprofil
Kundenbewertungen
4.8
Bewertungen: 5
5 | 80 % | |
4 | 20 % | |
3 | 0 % | |
2 | 0 % | |
1 | 0 % |
Kundenbewertungen
July 14, 2025
Pros: Polynomial regression with adjustable degree and deviation channels. Great for identifying trend zones and reversals. Works across timeframes. Cons: No alerts or tooltips. High polynomial degrees may cause lag. Lacks template saving for user settings.
May 1, 2025
This is very good Mate, i really like it, i am working o an Cbot with few indicators, could you share me this one code to include it?
Diskussion
Häufig gestellte Fragen (FAQ)
Über den cTrader Store verfügbare Produkte, einschließlich Handelsbots, Indikatoren und Plugins, werden von externen Entwicklern bereitgestellt und nur zu Informations- und technischen Zugriffszwecken verfügbar gemacht. cTrader Store ist kein Broker und erbringt keine Anlageberatung, persönlichen Empfehlungen oder eine Garantie für zukünftige Performance.
Mehr von diesem Autor


Preis
Seit 18/12/2024
2
Verkäufe
4.26K
Kostenlose Installationen