
E7 Harmonic Structures Basic
Indikator
647 downloads
Version 1.0, Feb 2025
Windows, Mac
5.0
Bewertungen: 2
Beschreibung
Der E7 Harmonic Structures Basic Indikator umfasst Folgendes:
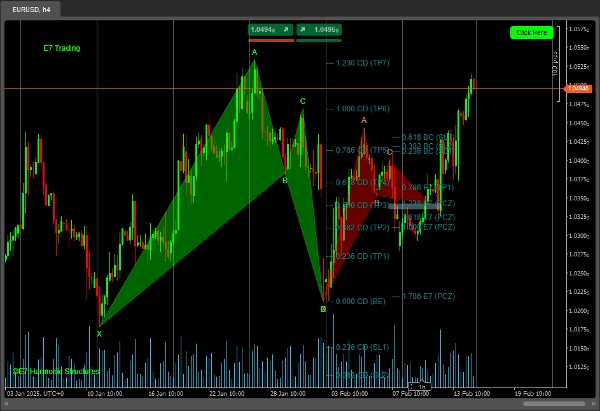
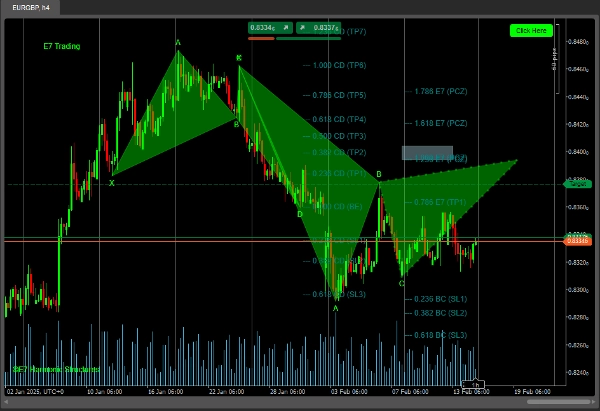
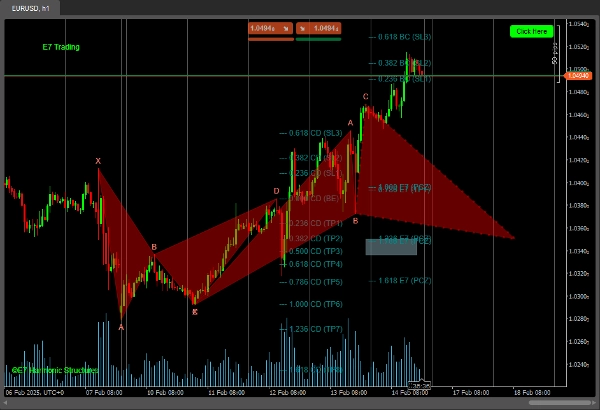
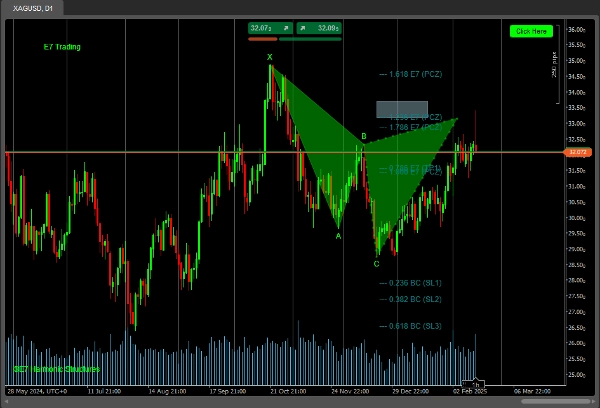
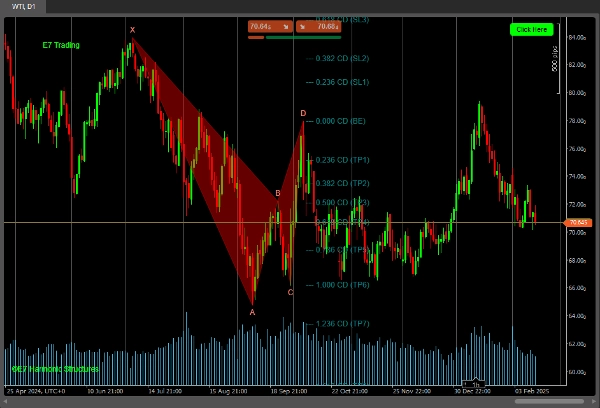
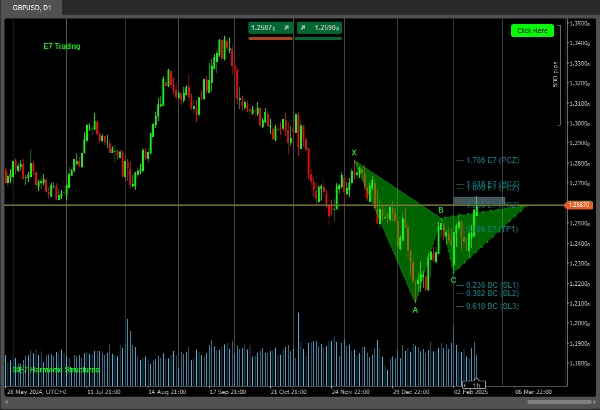
Punkt 'C' Strukturen und Punkt 'D' Strukturen.
Fib-Projektionen, PCZ und PRZ für eine bessere Analyse, wie in den E7-Strategien gelehrt.
Er enthält jedoch nur eine begrenzte Anzahl der folgenden Strukturen:
- Gartley
- Bat
- Butterfly
- Crab
- Cypher
* Dies ist eine Beta-Version.
Der vollständige Indikator umfasst viele weitere Strukturen und erscheint bald.
Viel Erfolg bei der Suche!
Zusammenfassung
KI-Zusammenfassung
E7 Harmonic Structures Basic is a technical indicator designed for harmonic pattern analysis in trading. It identifies Point 'C' and Point 'D' structures and incorporates Fibonacci projections, Potential Completion Zones (PCZ), and Potential Reversal Zones (PRZ) to support detailed market analysis as outlined in E7 Strategies. The indicator currently detects a limited set of harmonic patterns, including Gartley, Bat, Butterfly, Crab, and Cypher formations. This version is labeled as Beta, with a more comprehensive version including additional structures planned for future release.
Indikatorprofil
Kundenbewertungen
5.0
Bewertungen: 2
5 | 100 % | |
4 | 0 % | |
3 | 0 % | |
2 | 0 % | |
1 | 0 % |
Kundenbewertungen
August 12, 2025
Pros: Detects Bat, Gartley, Butterfly, Shark patterns automatically with PRZ visualization. Flexible settings. Cons: No tooltips or alerts. Missing pattern history log and template saving. Requires external confirmation (volume or PA).
April 22, 2025
I am currently testing your indicator and I must say it is very interesting. I am a fan of Fibonacci and today, April 22, 2025, it showed two beautiful structures on gold. Like from a book about trading. Best regards and I wish you continued success in improving the product. Artur
Diskussion
Häufig gestellte Fragen (FAQ)
Über den cTrader Store verfügbare Produkte, einschließlich Handelsbots, Indikatoren und Plugins, werden von externen Entwicklern bereitgestellt und nur zu Informations- und technischen Zugriffszwecken verfügbar gemacht. cTrader Store ist kein Broker und erbringt keine Anlageberatung, persönlichen Empfehlungen oder eine Garantie für zukünftige Performance.
Mehr von diesem Autor


Preis
Seit 18/12/2024
2
Verkäufe
4.26K
Kostenlose Installationen