
E7 Volume Profile
Indikator
1.16K downloads
Version 1.0, Feb 2025
Windows, Mac
4.6
Bewertungen: 3
Beschreibung
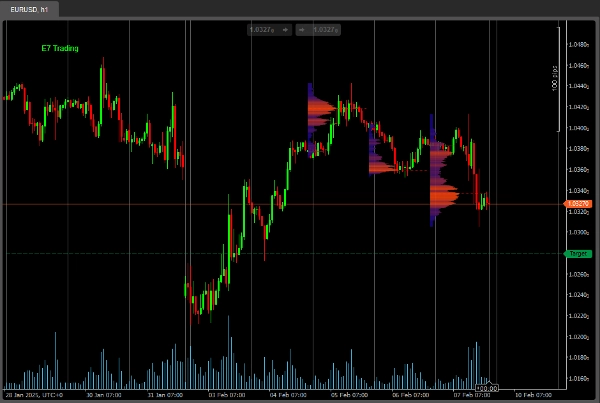
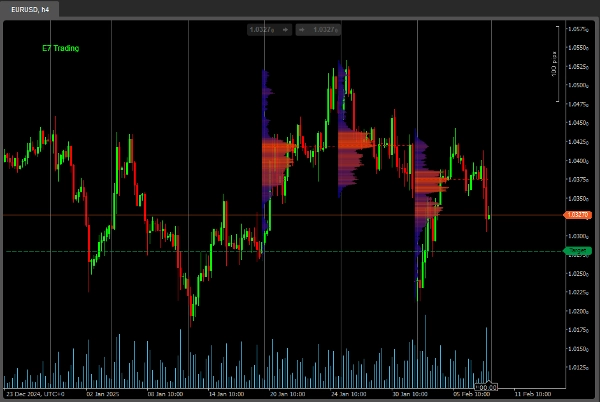
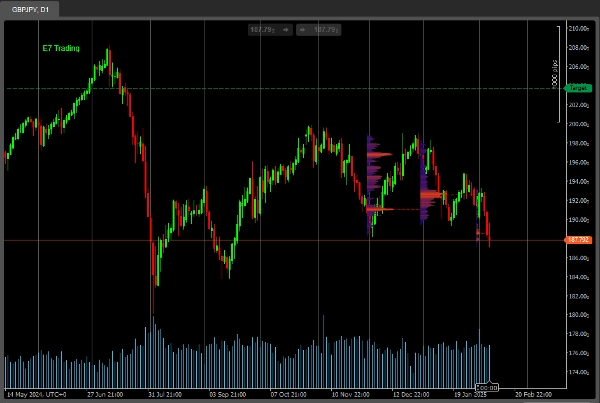
Dies ist ein einfacher Volume Profile Indikator, angepasst für ein moderneres Aussehen und Gefühl.
Diese Basisversion ist auf nur 3 'Lookback Periods' beschränkt.
Die Vollversion kommt bald, bleiben Sie dran.
Viel Erfolg bei der Suche!
Zusammenfassung
KI-Zusammenfassung
E7 Volume Profile is a volume profile indicator designed with a modern visual style. It provides traders with volume distribution information over price levels, helping to identify key support and resistance areas. This basic version supports analysis over three distinct lookback periods, allowing users to observe volume patterns within limited historical ranges. The indicator is suitable for use on various timeframes, as illustrated by examples on 1-hour, 4-hour, and daily charts. A full version with expanded features is planned for future release.
Indikatorprofil
Kundenbewertungen
4.6
Bewertungen: 3
5 | 67 % | |
4 | 33 % | |
3 | 0 % | |
2 | 0 % | |
1 | 0 % |
Kundenbewertungen
July 14, 2025
Pros: Clearly visualizes volume distribution with POC, VAH, VAL zones. Customizable and stable across timeframes. Cons: No tooltips or alerts. Lacks template saving and dynamic profile history. Requires confirmation tools for trading signals.
Diskussion
Häufig gestellte Fragen (FAQ)
Über den cTrader Store verfügbare Produkte, einschließlich Handelsbots, Indikatoren und Plugins, werden von externen Entwicklern bereitgestellt und nur zu Informations- und technischen Zugriffszwecken verfügbar gemacht. cTrader Store ist kein Broker und erbringt keine Anlageberatung, persönlichen Empfehlungen oder eine Garantie für zukünftige Performance.
Mehr von diesem Autor


![„[Hamster-Coder] Bollinger Bands“-Logo](https://cdn.ctrader.com/image/webp/21d8e5d6-fb11-4bac-b9ee-cd05c2b76804_30327)


Preis
Seit 18/12/2024
2
Verkäufe
4.26K
Kostenlose Installationen