
E7 BlackScholes Model
Indikator
252 downloads
Version 1.0, Feb 2025
Windows, Mac
5.0
Bewertungen: 1
Beschreibung
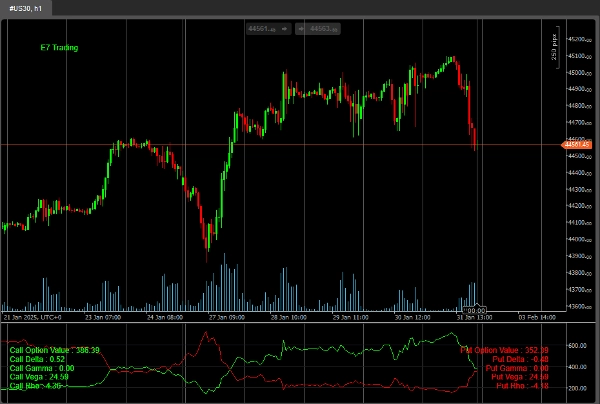
Dies ist ein sehr einfaches Beispiel für die Verwendung des Pakets ‚Math.Numerics‘ innerhalb von cTrader zur Berechnung von Optionspreisen mit dem Black-Scholes-Modell.
Zukünftige Versionen werden ausgefeiltere Implementierungen enthalten.
Dies sollte vorerst nur für Indizes verwendet werden, danke.
Viel Erfolg!
Zusammenfassung
KI-Zusammenfassung
E7 BlackScholes Model is an indicator designed for use within the cTrader platform that calculates option pricing based on the Black-Scholes model. It utilizes the Math.Numerics package to perform these calculations. Currently, the tool is intended primarily for indices such as NASDAQ, S&P 500, DAX, and Dow. The product offers a straightforward implementation of the Black-Scholes formula, with plans for more advanced versions in the future. This indicator assists traders in evaluating option prices on index markets by providing mathematical option valuation directly integrated into their trading environment.
Indikatorprofil
Kundenbewertungen
5.0
Bewertungen: 1
5 | 100 % | |
4 | 0 % | |
3 | 0 % | |
2 | 0 % | |
1 | 0 % |
Kundenbewertungen
August 18, 2025
Pros: Calculates Black–Scholes theoretical option price and Greeks (Delta, Gamma, Theta, Vega) in real‑time. Lightweight and intuitive interface. Great for risk management and option analysis. Cons: No alerts or tooltips. Lacks template saving and real‑price comparison. Assumes constant volatility
Diskussion
Häufig gestellte Fragen (FAQ)
Indices
Über den cTrader Store verfügbare Produkte, einschließlich Handelsbots, Indikatoren und Plugins, werden von externen Entwicklern bereitgestellt und nur zu Informations- und technischen Zugriffszwecken verfügbar gemacht. cTrader Store ist kein Broker und erbringt keine Anlageberatung, persönlichen Empfehlungen oder eine Garantie für zukünftige Performance.
Mehr von diesem Autor


Preis
Seit 18/12/2024
2
Verkäufe
4.25K
Kostenlose Installationen